
Explore Exponential vs. Linear Functions
Loading the math board and drawing, please wait…
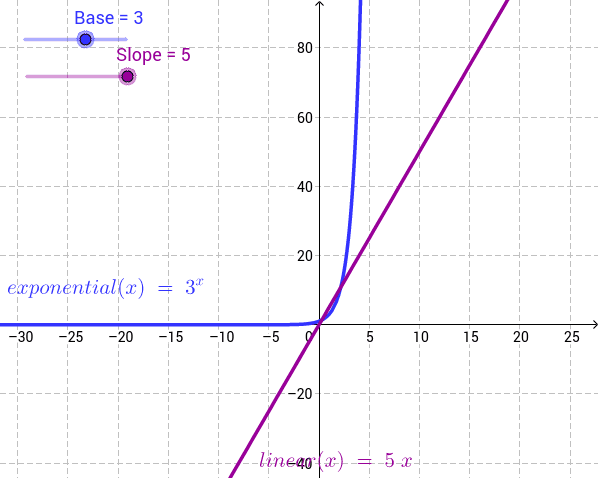
This example demonstrates the visual comparison between exponential and linear functions using sliders. Key math concepts include functions, exponential growth, linear growth, slope, and geometric intuition. Constructed with GeoGebra commands like Base, exponential, Slope, and linear. Ideal for high school mathematics education to help students understand the characteristics of different function models.
GeoGebra Commands & Parameters
Numeric Base(3.0)exponential(x) = Base^(x)Numeric Slope(5.0)linear(x) = Slope * x
AI Drawing Prompt Reference
Draw two function graphs in a coordinate system, one exponential and one linear, both adjustable with sliders. The exponential function has an initial base of 3, changing with the slider, while the linear function has an initial slope of 5, also adjustable. Clearly show the difference in growth rates between the two functions to help understand the characteristics of exponential and linear growth.
The prompt above was compiled from the original drawing commands and is for reference only.