
Exploration of Sine Curves in Polar Coordinates
Loading the math board and drawing, please wait…
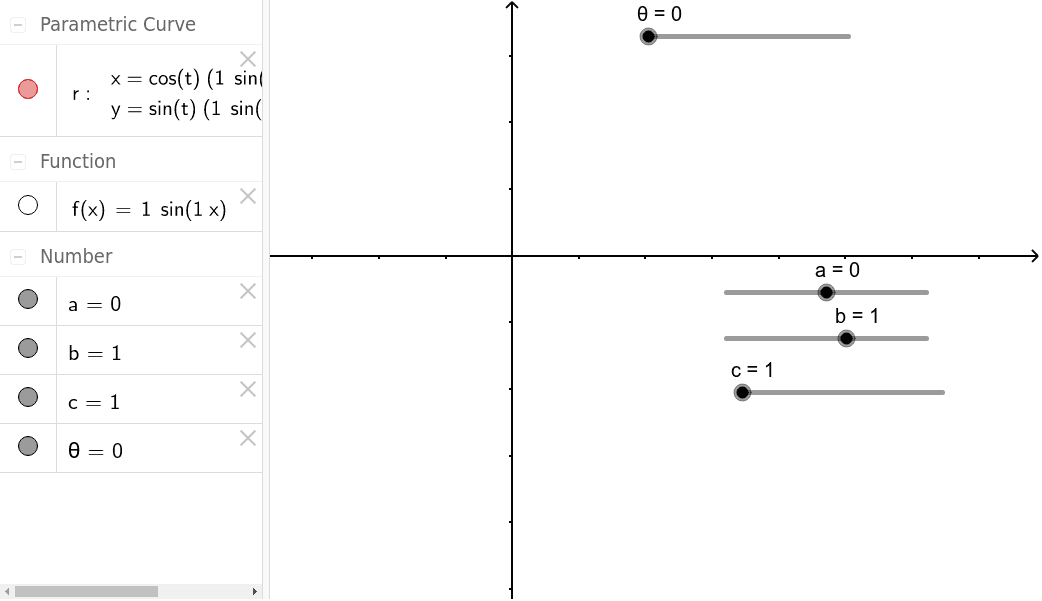
This example explores the characteristics of sine curves in polar coordinates. The sine function is a type of trigonometric function, and its graph shows periodic waveforms. By adjusting parameters, you can observe how the sine curve changes in the polar coordinate system. The CurveCartesian command is used to draw the curve, involving the definition of angle θ and radius r. Suitable for high school mathematics education, it helps students understand the periodicity and symmetry of the sine function.
GeoGebra Commands & Parameters
CurveCartesian((cos(t) * f(t)), (sin(t) * f(t)), t, 0, θ) → r
AI Drawing Prompt Reference
Draw a sine curve in polar coordinates, where the angle θ varies from 0 to a certain value, and the radius r is defined by cos(θ) * f(θ) and sin(θ) * f(θ), with f(θ) being the sine function. Observe the periodicity and symmetry of the sine curve to understand how the sine function changes in the polar coordinate system.
The prompt above was compiled from the original drawing commands and is for reference only.