
Exploration of Polar Graphs (Cosine)
Loading the math board and drawing, please wait…
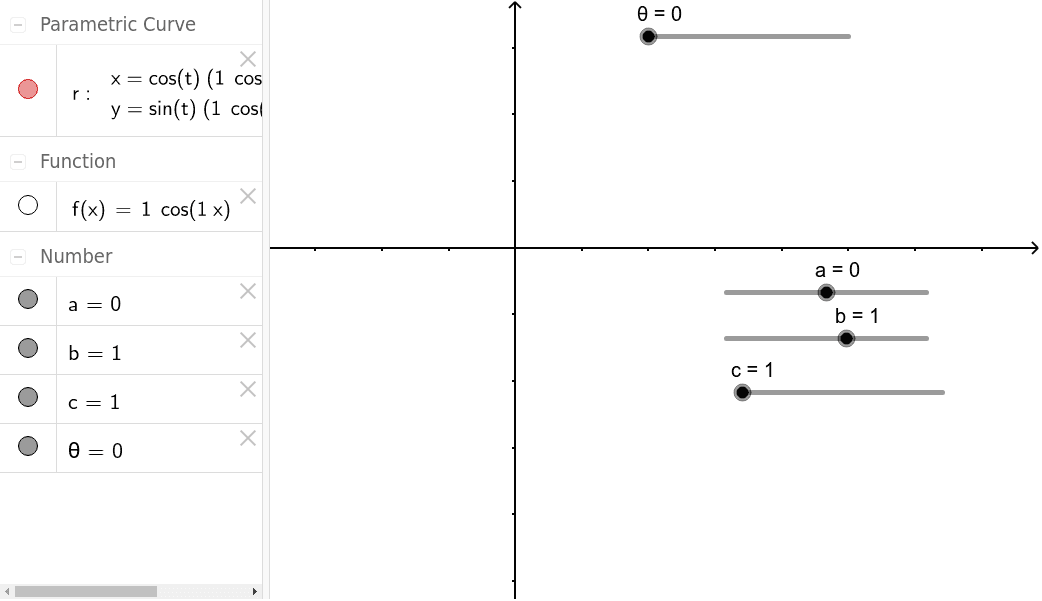
This example explores the changes in polar graphs of cosine functions by adjusting parameters. It covers core trigonometry concepts, demonstrating how cosine functions affect the shape of polar graphs. Using the CurveCartesian command, polar graphs are constructed. Suitable for high school math education, it helps students understand the relationship between polar coordinates and trigonometric functions.
GeoGebra Commands & Parameters
CurveCartesian((cos(t) * f(t)), (sin(t) * f(t)), t, 0, θ) → r
AI Drawing Prompt Reference
Create a polar graph showing the changes of the cosine function cos(t) * f(t) and sin(t) * f(t) as t varies from 0 to θ. Adjust the parameter f(t) to observe the changes in the polar graph and understand how the cosine function affects its shape.
The prompt above was compiled from the original drawing commands and is for reference only.