
Experimental Probability by mathspace
Loading the math board and drawing, please wait…
This example demonstrates calculating the probability of events through experimental data. It involves core math concepts like probability, random experiments, arithmetic mean, median line, division, line segments, and interest calculations. Construction highlights include commands like CountIf, Circle, Rotate, Vector, Line, OrthogonalLine, Intersect, CircleSector, Midpoint, IsInRegion, Sum, Element, TableText, FractionText, Sequence. Suitable for high school probability & statistics education and enrichment.
GeoGebra Commands & Parameters
CountIf(x ≟ "orange", B2:B11) → E7CountIf(x ≟ "violet", B2:B11) → E6CountIf(x ≟ "green", B2:B11) → E5CountIf(x ≟ "yellow", B2:B11) → E4CountIf(x ≟ "red", B2:B11) → E3CountIf(x ≟ "blue", B2:B11) → E2Circle(A, B) → cRotate(S0, (-(a°)), A) → CVector(A, C) → uLine(B, A) → bOrthogonalLine(A, b) → eIntersect(c, e) → D, ECircleSector(A, E, B) → fIntersect(c, b) → F, GMidpoint(G, E) → HLine(A, H) → gIntersect(c, g) → I, JCircleSector(A, J, E) → hCircleSector(A, G, J) → kCircleSector(A, D, G) → pCircleSector(A, I, D) → qCircleSector(A, B, I) → rIsInRegion(C, f) → iIsInRegion(C, h) → jSum(Sequence[(IsInRegion[C, Element[liste2, k]] * k), k, 1, 6]) → mElement(liste1, m) → texte1TableText({{A1, B1}, {A2, B2}, {A3, B3}, {A4, B4}, {A5, B5}, {A6, B6}, {A7, B7}, {A8, B8}, {A9, B9}, {A10, B10}, {A11, B11}}, "|_") → text1FractionText(F2) → F_22FractionText(F3) → F_32FractionText(F4) → F_42FractionText(F5) → F_52FractionText(F6) → F_62FractionText(F7) → F_72TableText({{D1, E1, F1}, {D2, E2, F_22}, {D3, E3, F_32}, {D4, E4, F_42}, {D5, E5, F_52}, {D6, E6, F_62}, {D7, E7, F_72}}, "|_") → text2Sequence("B" + (k) + "=" + (UnicodeToText[{34, 34}]), k, 2, 11) → l1
AI Drawing Prompt Reference
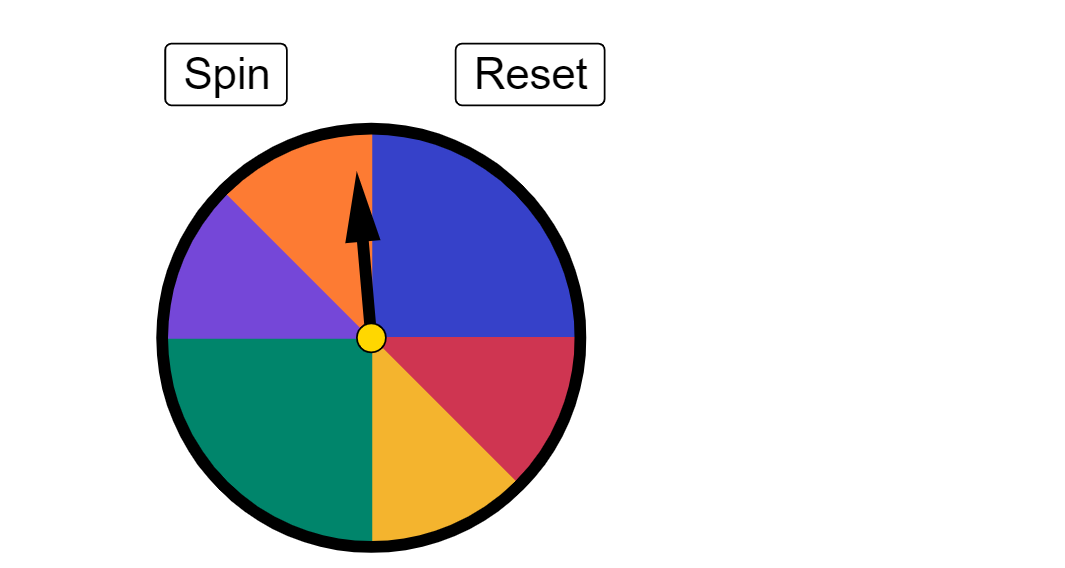
Draw a circle with a center point and another point on its circumference. From the center, draw a radius line and a perpendicular line intersecting the circle at two points. Use these intersections to divide the circle into six sector regions, each distinguished by color or label. Place a random point inside the circle and determine which sector it falls into. Beside the circle, show a data table recording the counts of the point landing in each sector over multiple trials, along with fractional frequencies for each sector. The overall figure illustrates estimating probabilities through experimental data.
The prompt above was compiled from the original drawing commands and is for reference only.