
Example QF.2.4
Loading the math board and drawing, please wait…
This example demonstrates the properties of quadrilaterals. Key mathematical concepts include quadrilaterals, trigonometric functions, and power functions. Using GeoGebra commands such as Point, Vector, and Textfield, the construction of quadrilaterals and related elements is illustrated. Suitable for high school mathematics education and learning.
GeoGebra Commands & Parameters
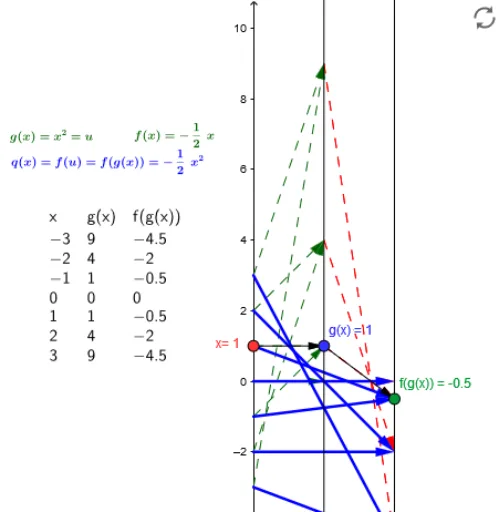
Point(yAxis) → AVector(A, B) → uVector(B, C) → vTextfield(g) → inputBox1Textfield(f) → inputBoxfSequence(-3, 3, dx) → NZip(Vector[(2, g(z)), (4, f(g(z)))], z, N) → fgx_*Zip(Vector[(0, z), (2, g(z))], z, N) → g_*Zip((z, g(z)), z, N) → Pg_*Zip((z, f(g(z))), z, N) → Pfg_*Zip(Vector[(0, z), (4, f(g(z)))], z, N) → qx_*TableText(Transpose[{Append["x", N], Append["g(x)", g(N)], Append["f(g(x))", f(g(N))]}]) → Table
AI Drawing Prompt Reference
On a coordinate plane, start by placing a point on the vertical axis as an origin, then draw two vectors from this point to two other points, forming the basic framework of a quadrilateral. Next, add two interactive input boxes to adjust the expressions of two functions. Then, over a horizontal range from -3 to 3 with a fixed step, generate a sequence of points)Skip. Based on these points, draw several sets of vectors: one set from points on the horizontal axis to corresponding points on the graph of the first function, another set from those points to points on the graph of the composed function, and a third set directly from the horizontal axis to the composed function graph. Also mark discrete point sequences on both function graphshol. Finally, create a table listing the x-coordinates, the first function values, and the composed function values to illustrate the function composition relationship.
The prompt above was compiled from the original drawing commands and is for reference only.