
Example of Quantiles in a Continuous Random Variable
Loading the math board and drawing, please wait…
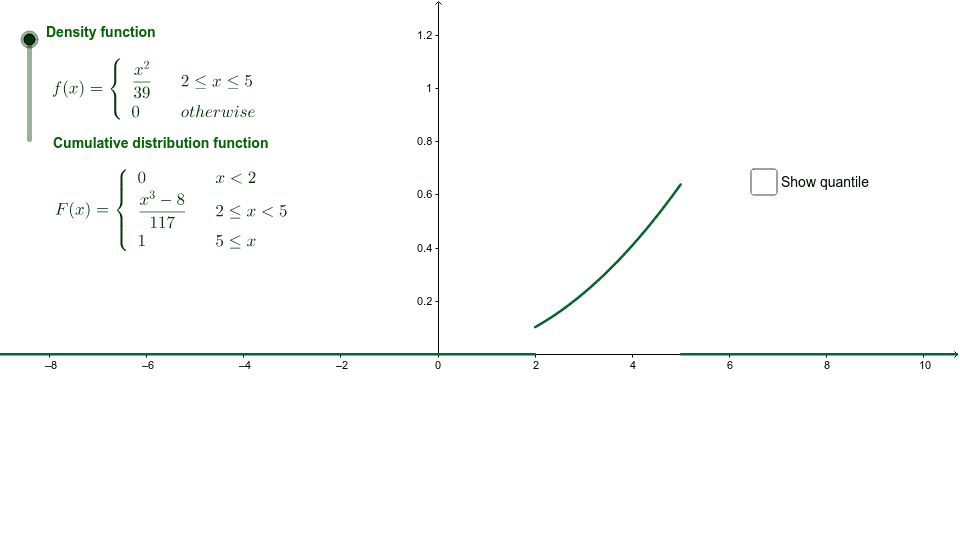
This GeoGebra example dynamically illustrates the concept of quantiles (such as median and quartiles) for a continuous random variable. It demonstrates how a quantile corresponds to a value on the x-axis where the cumulative probability equals a given threshold, visualized as the area under the probability density function. Core mathematical concepts include probability density functions, cumulative distribution functions, quantile definition, and the relationship between probability area and critical values. The construction uses GeoGebra commands like Integral to compute areas under the curve, Point, Segment, and Vector to mark quantile positions, and sliders (e.g., alpha, alpha2) to adjust probability levels interactively, showing the corresponding quantile coordinates in real time. Suitable for high school and university courses in probability and statistics, this example helps students grasp the geometric meaning of quantiles, especially the median, and how they depend on the distribution's shape.
GeoGebra Commands & Parameters
Integral(g, cdchan, 40) → areaDchaIntegral(g, -4, cdchan) → areaDchaCPoint(xAxis) → CPoint(g) → DSegment(C, D) → aVector(J, I) → uVector(I, H) → vVector(L, K) → w