
Evaluating Functions and Graphing Ordered Pairs
Loading the math board and drawing, please wait…
In collections
Algebra 1
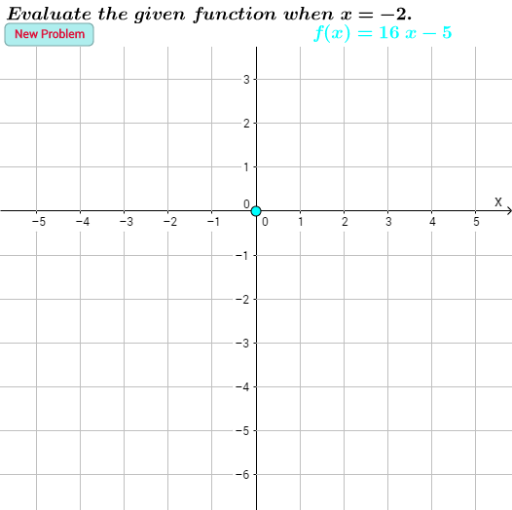
This example demonstrates how to evaluate functions by inputting independent variables and plotting corresponding ordered pairs on a coordinate system. Core math concepts include function evaluation, ordered pairs, coordinate system, and linear function graphs. It utilizes GeoGebra commands/objects like a, b, c, d, e, f, j, g, h, r, p_8, A, p, p_1, p_2, p_3, p_4, p_5, p_6, i, k, l, m, n, o, text1, text2, text3, text4, text5, text6, F, G, H, J, R, button2, P, text7, text8 for defining variables, functions, points, and texts. Suitable for middle school and above students learning function concepts, coordinate geometry, and data processing.
GeoGebra Commands & Parameters
Numeric a(16)Numeric b(-5)Numeric c(1)Numeric d(-11)Numeric e(-6)f(x) = (a * x) + bj(x) = (c * abs(x + d))g(x) = (e * (x - c))h(x) = d - (a * x)r(x) = (a * x^(2)) - dp_8(x) = ((-c) * abs(x + b))(0, 0)Numeric p(-2)f(p)g(p)h(p)j(p)p_8(p)r(p)Boolean i(true)Boolean k(false)Boolean l(false)Boolean m(false)Boolean n(false)Boolean o(false)(p, p_1)(p, p_2)(p, p_3)(p, p_4)(p, p_6)(p, p_5)