
Euclidean Division and Asymptotes
Loading the math board and drawing, please wait…
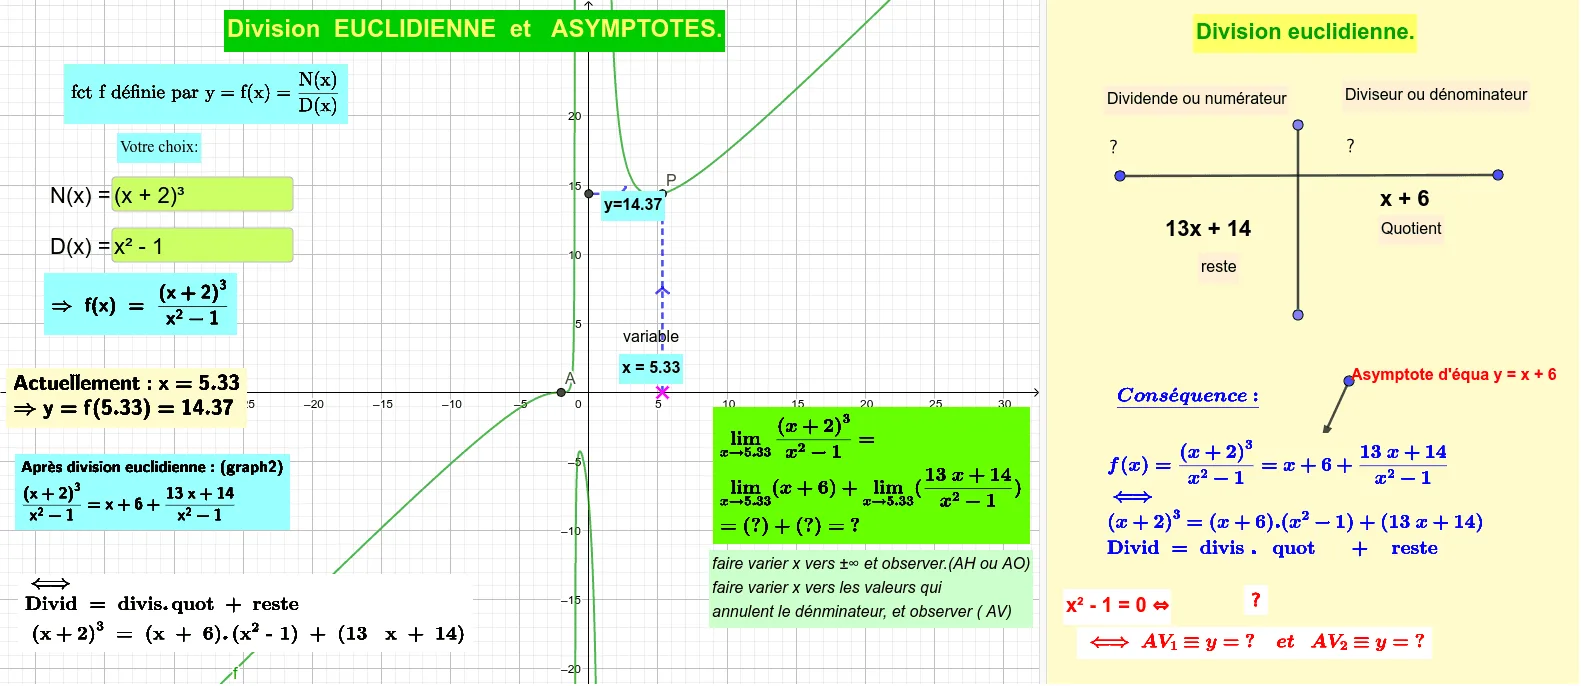
This example illustrates the process of Euclidean division and demonstrates the properties of asymptotes. It involves integer division, remainders, and how to construct these mathematical objects using GeoGebra. By constructing points, vectors, functions, and other objects, users can visually understand the steps of Euclidean division and the definition of asymptotes. Suitable for high school mathematics education and learning.
GeoGebra Commands & Parameters
Root(N) → A, BTextfield(N) → ChampTexte1Textfield(D) → ChampTexte2Asymptote(f) → L_1Division(N, D) → L_2Element(L_2, 1) → gElement(L_2, 2) → hPoint(xAxis) → CSegment(C, P) → iSegment(P, E) → jElement(L_2, 1) → quoElement(L_2, 2) → restSegment(F, G) → kPoint(yAxis) → HPoint(yAxis) → ISegment(H, I) → lVector(J, K) → uLaTeX($6) → texte24Root(D) → L, MElement(L_1, 2) → AV_1Element(L_1, 3) → AV_2LimitAbove(g, c) → qLimitAbove(p, c) → rLimitAbove(f, c) → aLaTeX($11) → texte27LaTeX($9) → texte26
AI Drawing Prompt Reference
Draw the graph of Euclidean division and asymptotes. First, input two integers N and D, then perform the division to get the quotient and remainder. Next, draw points C and H on the x-axis and y-axis, respectively, and connect them to form segments. Construct the asymptote L1 and show its properties. Finally, demonstrate the process of Euclidean division using the integers N and D, including the segments representing the quotient and remainder.
The prompt above was compiled from the original drawing commands and is for reference only.