
Estimating Mean from a Frequency Table
Loading the math board and drawing, please wait…
In collections
Resources for New A-level Maths Spec
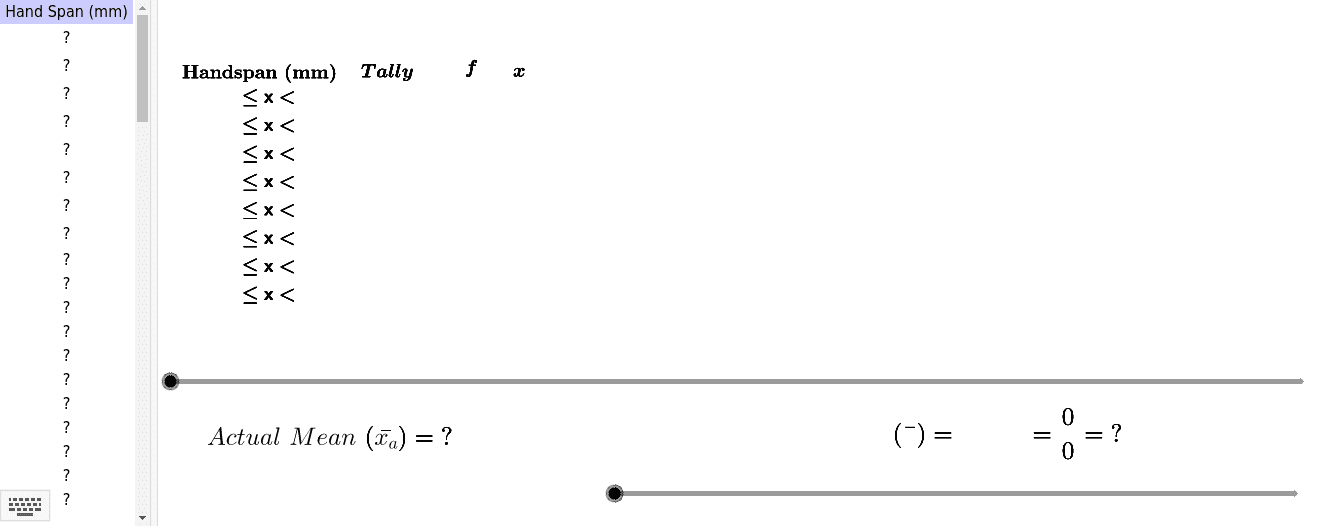
This example demonstrates how to calculate the actual mean from a frequency table by asking students to measure and input their hand-spans in millimeters. It covers frequency distribution, mean calculation, and data processing. Key GeoGebra commands used include Sort, CountIf, Sequence, Sum, Join, Mean, TableText, and Polygon. Suitable for middle school and above, focusing on statistics and data analysis education.
GeoGebra Commands & Parameters
Sort(RemoveUndefined[A2:A1000]) → list1CountIf(C2 ≤ x < E2, list1) → G2CountIf(C3 ≤ x < E3, list1) → G3CountIf(C4 ≤ x < E4, list1) → G4CountIf(C5 ≤ x < E5, list1) → G5CountIf(C6 ≤ x < E6, list1) → G6CountIf(C7 ≤ x < E7, list1) → G7Sequence(H3, i, 0, G3 - 1) → list3Sequence(H2, i, 0, G2 - 1) → list2Sequence(H4, i, 0, G4 - 1) → list4Sequence(H5, i, 0, G5 - 1) → list5Sequence(H6, i, 0, G6 - 1) → list6Sequence(H7, i, 0, G7 - 1) → list7CountIf(C8 ≤ x < E8, list1) → G8CountIf(C9 ≤ x < E9, list1) → G9Sequence(H8, i, 0, G8 - 1) → list8Sequence(H9, i, 0, G9 - 1) → list9Sort(RemoveUndefined[A2:A100]) → list1_1CountIf(C3 < x ≤ E3, list1_1) → G3_1CountIf(C4 < x ≤ E4, list1_1) → G4_1CountIf(C2 < x ≤ E2, list1_1) → G2_1Sort(RemoveUndefined[A2:A100]) → list1_2CountIf(C3 < x ≤ E3, list1_2) → G3_2CountIf(C4 < x ≤ E4, list1_2) → G4_2CountIf(C2 < x ≤ E2, list1_2) → G2_2Sum(G2:G9) → G10Sum(K2:K9) → K10Join({list2, list3, list4, list5, list6, list7, list8, list9}) → list10Sort(list1) → list11Mean(list1) → aTableText({{C1, D1, E1, F1, G1, H1, I1, J1, K1}, {C2, D2, E2, F2, G2, H2, I2, J2, K2}, {C3, D3, E3, F3, G3, H3, I3, J3, K3}, {C4, D4, E4, F4, G4, H4, I4, J4, K4}, {C5, D5, E5, F5, G5, H5, I5, J5, K5}, {C6, D6, E6, F6, G6, H6, I6, J6, K6}, {C7, D7, E7, F7, G7, H7, I7, J7, K7}, {C8, D8, E8, F8, G8, H8, I8, J8, K8}, {C9, D9, E9, F9, G9, H9, I9, J9, K9}, {C10, D10, E10, F10, G10, H10, I10, J10, K10}}, "l_") → text5Polygon(A, C, D, B) → poly1, a_1, c_1, d, b_1Polygon(G, H, F, E) → poly2, g, h, f, e_1
AI Drawing Prompt Reference
Create a frequency distribution table showing data ranges and counts, calculate the mean, and represent the data distribution with polygons. Start by plotting data points and range lines, then connect them to form polygons, and finally label the mean and frequency information.
The prompt above was compiled from the original drawing commands and is for reference only.