
Errors in Regression Line (when data not normalized)
Loading the math board and drawing, please wait…
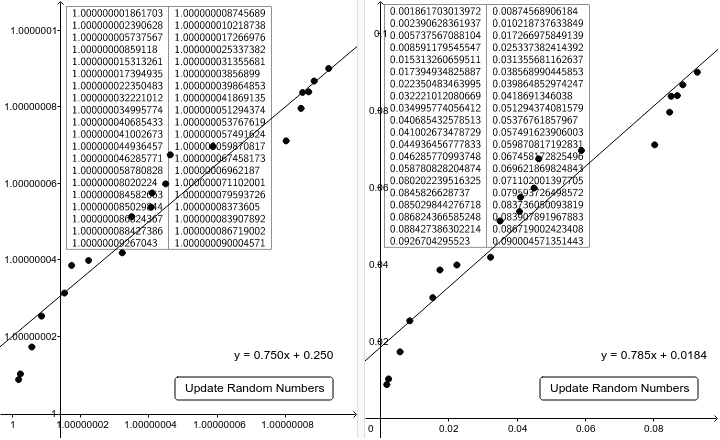
This example demonstrates the errors in the regression line when the data is not normalized. Key math concepts include linear regression, covariance, standard deviation, and mean. It uses GeoGebra commands and objects like Sort, Sequence, FitLineY, TableText, Covariance, SDX, MeanX, MeanY. Suitable for high school and above students to understand the impact of data preprocessing on regression analysis.
GeoGebra Commands & Parameters
Sort(Sequence[random(), i, 1, 20]) → list8Sort(Sequence[random(), i, 1, 20]) → list7Sequence(1 + Element[list7, i] / n, i, 1, 20) → list1Sequence(1 + Element[list8, i] / n, i, 1, 20) → list2Sequence((Element[list1, i], Element[list2, i]), i, 1, 20) → list3Sequence((Element[list4, i], Element[list5, i]), i, 1, 20) → list6FitLineY(list6) → cTableText({list1, list2}, "v|111_100000000000000000001") → text1TableText({list4, list5}, "v|111_100000000000000000001") → text2Covariance(list3) → covSDX(list3) → sdxMeanX(list3) → meanxMeanY(list3) → meany
AI Drawing Prompt Reference
Draw two sets of random data points and display their scatter plots and regression lines after normalization. Generate two sets of random data, then normalize them by dividing each data point by the number of data points and adding 1. Plot the original and normalized data points on a coordinate system, and label them. Fit a regression line to the normalized data points, display its equation, and calculate and display the covariance, standard deviation, and mean of the normalized data to show the impact of data preprocessing on regression analysis.
The prompt above was compiled from the original drawing commands and is for reference only.