
Line of Best Fit
Loading the math board and drawing, please wait…
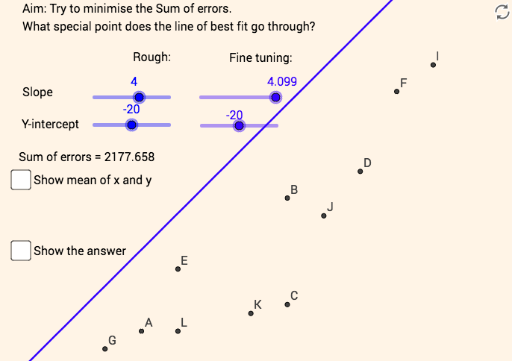
This example demonstrates how to draw the best fit line for data points using the least squares method. Core math concepts include least squares, mean, and coordinate geometry. Construction highlights involve commands like SumSquaredErrors and Mean, along with objects e, d, b, a, A1-A12, B1-B12, list1, list2. Suitable for high school and above students learning data analysis and statistical modeling.
GeoGebra Commands & Parameters
SumSquaredErrors(list3, f) → cMean(A1:A12) → A13Mean(B1:B12) → B13SumSquaredErrors(list3, j) → l
AI Drawing Prompt Reference
Draw the best fit line for a set of data points using the least squares method. First, calculate the average x and y coordinates of the points, then compute the sum of squared errors between the data points and the fitted line, and finally draw the line based on these values.
The prompt above was compiled from the original drawing commands and is for reference only.