
Equivalent Fractions Rectangular Models
Loading the math board and drawing, please wait…
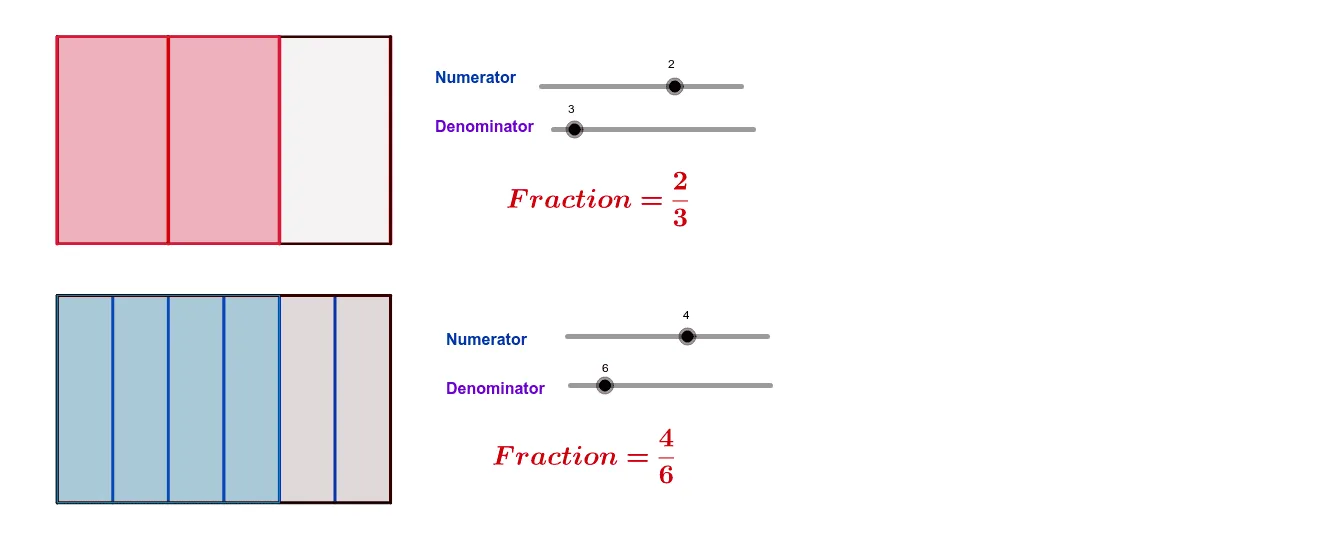
This example visually demonstrates the concept of equivalent fractions using dynamic rectangular models. It involves core math concepts like fractions, geometric models, and proportional relationships. Constructed with GeoGebra commands such as Intersect, Point, Polygon, Segment, and Sequence, it is suitable for middle school mathematics education to illustrate the connection between fractions and geometric shapes.
GeoGebra Commands & Parameters
Intersect(xAxis, yAxis) → APoint(xAxis) → BPoint(yAxis) → CPolygon(A, B, D, C) → poly1, a, b, d, cSegment(A, B) → fSequence(((10 / n * i), 0), i, 1, n) → list1Sequence(((10 / n * j), 4), j, 0, n) → list2Polygon((0, 0), ((10 / n * k), 0), ((10 / n * k), 4), (0, 4)) → poly2, g, h, i, jSequence(Segment[((10 / n * k), 0), ((10 / n * k), 4)], k, 0, n - 1) → list3Point(yAxis) → EPoint(yAxis) → HPolygon(E, F, G, H) → poly3, e, f_1, g_1, h_1Sequence((0 + (10 / m * i), 5), i, 0, m) → list4Sequence(Segment[(0 + (10 / m * j), 5), (0 + (10 / m * j), 9)], j, 0, m) → list6Sequence((0 + (10 / m * j), 9), j, 0, m) → list5Sequence(Segment[list4(k), list5(k)], k, 1, m) → list7Polygon((0, 5), ((10 / m * q), 5), ((10 / m * q), 9), (0, 9)) → poly4, l, p, r, s
AI Drawing Prompt Reference
Draw a dynamic rectangular model to demonstrate the concept of equivalent fractions, consisting of two parts: the first part shows a rectangle divided into n equal parts by horizontal line segments, with a bottom rectangle whose number of divisions changes by moving a slider; the second part shows a rectangle divided into m equal parts by vertical line segments, with a top rectangle whose number of divisions changes by moving another slider, illustrating the equivalence of different fractions.
The prompt above was compiled from the original drawing commands and is for reference only.