
Equation of Tangent to Curve - Self Assessment
Loading the math board and drawing, please wait…
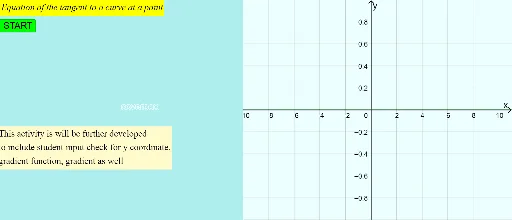
① This example demonstrates how to dynamically draw the tangent line to any function curve in GeoGebra and lets learners input their own function expressions for self‑assessment. ② Core calculus concepts include derivatives, tangent slope, function graphs, and tangent line equations. ③ Construction highlights: commands and objects such as Tangent, Slope, Derivative (implicit in Tangent), Point, InputBox, Textfield, If, Line, Polygon, Min, Max, Extremum, Coefficients, Corner, and UI elements (f, g, A, B, C, D, K, L_1, textEqnLine, button1, button2, etc.) build the interactive interface. ④ Suitable for high‑school derivative modules, introductory university calculus review, or teacher classroom demonstrations and self‑testing.
GeoGebra Commands & Parameters
Min(f, xmin, xmax) → KMin(f, -10, 10) → BMax(f, -10, 10) → CMax(f, xmin, xmax) → JExtremum(f, xmin, xmax) → D, , , , ,Textfield(textfx) → InputBox1Point(f) → ATangent(A, f) → gSlope(g) → mCoefficients(f) → L_1Corner(1) → C_1Corner(4) → C_4Polygon(C_1, C_2, C_3, C_4) → coverbox, d, e, f_1, g_1If(Defined[D], Min[Max[Max[Min[(2 * xmax) - 3, y(C) - 5], y(D)], y(J)] + 1, 30], Min[Max[Min[(2 * xmax) - 3, y(C) - 5], y(J)] + 1, 30]) → ymaxTextfield(textfli) → InputBox2Line((xmin, f_{li}(xmin)), (xmax, f_{li}(xmax))) → lineinput
AI Drawing Prompt Reference
Draw a function curve and its tangent line. First, input a function expression, then dynamically plot the function's graph. Next, select a point on the graph and draw the tangent line through that point, showing the slope of the tangent line. Also, display the function's extremum points and the maximum and minimum values within the domain. Finally, generate an input box based on the function expression for users to input new expressions for self-assessment.
The prompt above was compiled from the original drawing commands and is for reference only.