
Energy Diagram Demo
Loading the math board and drawing, please wait…
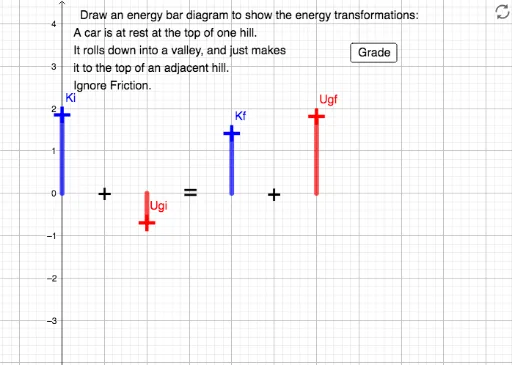
This example demonstrates the representation and calculation of energy diagrams in physics and chemistry. It involves core concepts like energy transformation, vector addition, tree diagram analysis, and variance computation. Constructed using GeoGebra commands and objects such as Intersect, Point, Line, Segment, and If. Suitable for high school students and teachers learning energy conversion and data analysis.
GeoGebra Commands & Parameters
Intersect(xAxis, yAxis) → APoint(Circle[A, 1]) → BLine(D, E) → gPoint(yAxis) → CLine(C, yAxis) → fLine(F, f) → hLine(G, f) → iLine(H, f) → jIntersect(f, xAxis) → IIntersect(h, xAxis) → JIntersect(i, xAxis) → KIntersect(j, xAxis) → LPoint(f) → KiPoint(h) → UgiPoint(i) → KfPoint(j) → UgfSegment(Ki, I) → kSegment(Ugi, J) → lSegment(Kf, K) → Kf_1Segment(Ugf, L) → Ugf_1If(-0.1 < y(Ki) < 0.1, true, false) → KiCheckIf(-0.1 < deltaE < 0.1, true, false) → deltaECheckIf(-0.1 < y(Kf) < 0.1, true, false) → KfCheckIf(KfCheck ∧ KiCheck ∧ deltaECheck, 1, 0) → grade
AI Drawing Prompt Reference
Draw an energy diagram with x and y axes, including a circle centered at the origin with radius 1 to get a point. Construct two line segments connecting points to form a triangle. From the vertices of the triangle, draw perpendicular lines to the x-axis to get four intersection points. Connect these points with their corresponding perpendicular lines to form several rectangles. Finally, determine and display whether the diagram is correct based on the positions of the points.
The prompt above was compiled from the original drawing commands and is for reference only.