
Energy Diagram 1a
Loading the math board and drawing, please wait…
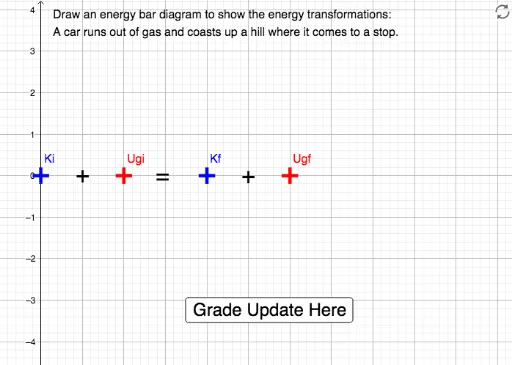
This example demonstrates how energy diagrams are used in physics or chemistry, involving core math concepts like quadratic functions, continuity, and plane figure transformations. It constructs the diagram using commands such as Intersect, Point, Line, Segment, and If. Suitable for high school physics or mathematics education to understand energy changes and function graphs.
GeoGebra Commands & Parameters
Intersect(xAxis, yAxis) → APoint(Circle[A, 1]) → BLine(D, E) → gPoint(yAxis) → CLine(C, yAxis) → fLine(F, f) → hLine(G, f) → iLine(H, f) → jIntersect(f, xAxis) → IIntersect(h, xAxis) → JIntersect(i, xAxis) → KIntersect(j, xAxis) → LPoint(f) → KiPoint(h) → UgiPoint(i) → KfPoint(j) → UgfSegment(Ki, I) → kSegment(Ugi, J) → lSegment(Kf, K) → Kf_1Segment(Ugf, L) → Ugf_1If(-0.1 < y(Kf) < 0.1, true, false) → KfCheckIf(y(Ki) > 0, true, false) → KiCheckIf(-0.1 < deltaE < 0.1, true, false) → deltaECheckIf(KfCheck ∧ KiCheck ∧ deltaECheck, 1, 0) → grade
AI Drawing Prompt Reference
Draw an energy diagram with a parabola opening upwards and intersecting the x-axis at points I and L, and the y-axis at point B. Draw a horizontal line f through point B, intersecting the parabola at points I and K. Then draw two parallel lines h and i through points J and K, L respectively, intersecting the parabola. Connect points I, J, K, and L to form the energy change diagram.
The prompt above was compiled from the original drawing commands and is for reference only.