
Empty Statistics, Normal Distribution
Loading the math board and drawing, please wait…
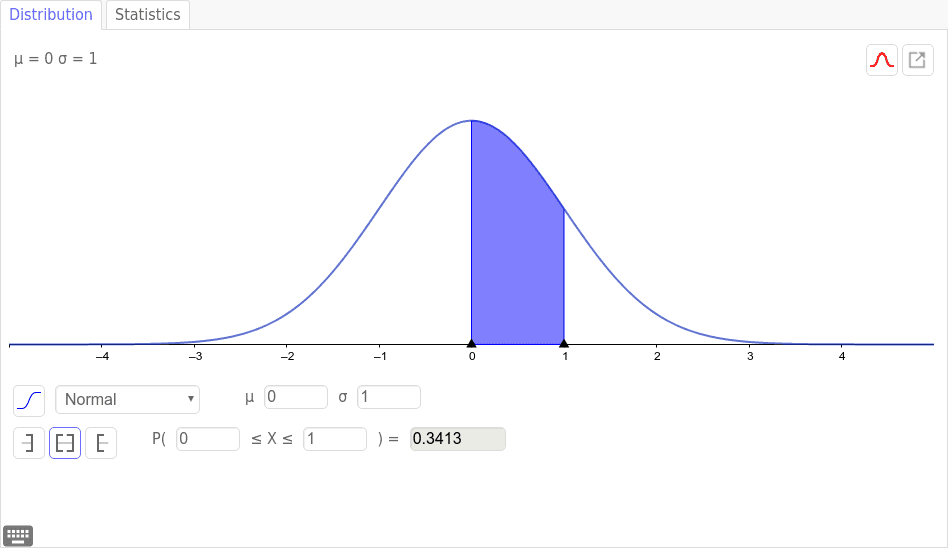
This example demonstrates the calculation of area under the normal distribution curve and statistical properties. Core concepts include normal distribution, probability & statistics, integral, and function graphing. It uses GeoGebra commands for function plotting, integral calculation, and slider animation. Suitable for high school students and statisticians to understand the geometric meaning and practical applications of the normal distribution.
AI Drawing Prompt Reference
Draw a normal distribution curve with its area under the curve illustrated, showing the integral calculation through animation to highlight core concepts in probability and statistics, suitable for students and statisticians to understand geometric meaning and practical applications.
The prompt above was compiled from the original drawing commands and is for reference only.