
Graphical Demonstration of the Limit for Derivatives
Loading the math board and drawing, please wait…
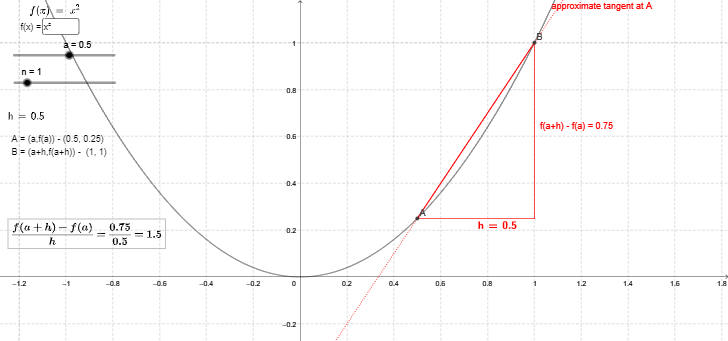
This example visually demonstrates the limit definition of a derivative, showing the expression [f(a+h) - f(a)]/h as h approaches zero geometrically. It involves core mathematical concepts such as limits, derivatives, function graphs, and line slopes. The construction uses GeoGebra commands and objects like Textfield, Segment, Line, LaTeX, and Midpoint to create function graphs, points, line segments, and textual explanations. It is suitable for high school mathematics teaching to intuitively understand the definition and geometric meaning of derivatives.
GeoGebra Commands & Parameters
Textfield(f) → inputBox1Segment(A, B) → bLine(A, B) → cSegment(A, C) → dSegment(B, C) → eLaTeX(h, true, true) → text1LaTeX(h, true, true) → text4Midpoint(A, C) → D
AI Drawing Prompt Reference
Draw a function graph and demonstrate the limit definition of a derivative. Mark points A and C on the graph, connect them to form segment AC. Also, connect point A to point B to form segment AB. Based on these segments, draw two lines representing the secant and tangent. Label the variable h appropriately and display the formula (f(a+h) - f(a))/h in the graph, also mark the midpoint D of segment AC.
The prompt above was compiled from the original drawing commands and is for reference only.