
Empirical Rule
Loading the math board and drawing, please wait…
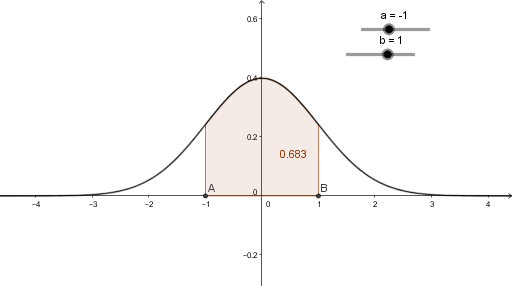
This example illustrates the Empirical Rule, which describes the distribution of data in a normal distribution. Key mathematical concepts include normal distribution, standard deviation, and percentiles. The Integral command is used to calculate probability areas. Suitable for high school and above students to learn probability and statistics.
GeoGebra Commands & Parameters
Integral(f, a, b) → c
AI Drawing Prompt Reference
Draw a normal distribution curve and label the mean and two standard deviation ranges, shade areas to show approximately 68% of data within one standard deviation, 95% within two, and 99.7% within three, calculate the probability of these areas using integrals.
The prompt above was compiled from the original drawing commands and is for reference only.