
Exponents - Power to Power Interactive Demo
Loading the math board and drawing, please wait…
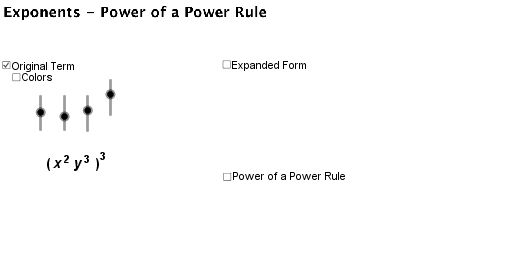
This GeoGebra example dynamically demonstrates the 'power to power' rule of exponents, i.e., (a^m)^n = a^(m·n). The core mathematical concepts include exponentiation, the power-of-a-power property, algebraic expansion, and function graphing. The construction uses GeoGebra commands such as Text, If, Translate, and Sequence, along with objects like expX1, exp, expY1, and various text elements, to create interactive displays where users can adjust bases and exponents via sliders or inputs, seeing the step-by-step expansion and result in real time. It is suitable for middle school (upper grades) and high school mathematics, serving as a visual aid for teachers in classroom demonstrations or for students' self-directed exploration of exponent rules.
GeoGebra Commands & Parameters
Text("y") → text6Text("x") → text5Text(expX1 + "") → text8Text(expY1 + "") → text10If(color, 255, 0) → factorColor255If(color, 153, 0) → factorColor153Translate((6.923609046978582, -1.782455570499752), Vector[(0, 0), (0, -3)]) → ATranslate((6.923609046978582, 0.217544429500248), Vector[(0, 0), (0, -3)]) → BTranslate((7.524258469913336, 0.217544429500248), Vector[(0, 0), (0, -3)]) → CTranslate((7.524258469913336, -1.782455570499752), Vector[(0, 0), (0, -3)]) → DSequence(Translate[If[expY1 ≟ 1, y1, If[expY1 ≟ 2, y2, If[expY1 ≟ 3, y3, If[expY1 ≟ 4, y4, y5]]]], Vector[(0, 0), ((0.7 * i), 0)]], i, 0, exp - 1) → ExpandYSequence(Translate[If[expX1 ≟ 1, x1, If[expX1 ≟ 2, x2, If[expX1 ≟ 3, x3, If[expX1 ≟ 4, x4, x5]]]], Vector[(0, 0), ((0.7 * i), 0)]], i, 0, exp - 1) → ExpandX
AI Drawing Prompt Reference
Create an interactive demonstration of the power-to-power exponent rule, showing that (a^m)^n equals a^(m·n). Include coordinate axes with x and y labels. Use sliders or input fields to adjust the base and exponents, causing the graph to dynamically expand and display multiple identical factor terms, each shown as colored text arranged horizontally in sequence. Also display the expanded expression and final result, with arrows or translations indicating the merging process. The layout should be clear for classroom use, emphasizing step-by-step derivation of exponent operations.
The prompt above was compiled from the original drawing commands and is for reference only.