
Graph of f(|x|): Absolute Value Symmetry Transformation
Loading the math board and drawing, please wait…
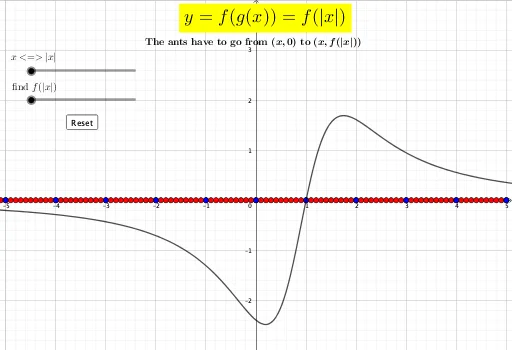
This example demonstrates how to plot the graph of f(|x|) by applying the absolute value transformation to the input variable, showing that the left half of the original function graph is replaced by the mirror image of the right half across the y-axis. Core mathematical concepts include properties of absolute value, symmetry transformations of function graphs, and piecewise function representation. Construction highlights: using GeoGebra's Sequence command to generate dynamic sequences, a button (button1) to control animation, sliders n and d to adjust drawing precision and range, functions f, g, h for different expressions, points X, Q, Z, S and texts text1, text6_1 for annotations, and coordinate bounds xl, xr, yt, yb for proper display. Suitable for high school and above to study function transformations and graphing, as well as for university-level basic mathematics to understand how absolute value affects domain and range.
GeoGebra Commands & Parameters
Sequence(-6 + (0.1 * i), i, 0, 110) → XSequence(i, i, -6, 5) → Z
AI Drawing Prompt Reference
Create a plot related to an absolute-value symmetry transformation for function inputs. First, generate an evenly spaced sequence of x-values starting from about -6 with step 0.1, extending to roughly 5, and display these as a point set labeled X. In parallel, generate a second sequence of input values labeled Z using the same parameter i and the same interval limits, covering approximately from -6 to 5. Ensure both point sets share the same coverage range so they can represent corresponding inputs before applying the mirror symmetry across the y-axis. Arrange them on the coordinate plane as foundational input points for the f(|x|) construction.
The prompt above was compiled from the original drawing commands and is for reference only.