
Effect of Parameters on Standard Form Quadratic Function
Loading the math board and drawing, please wait…
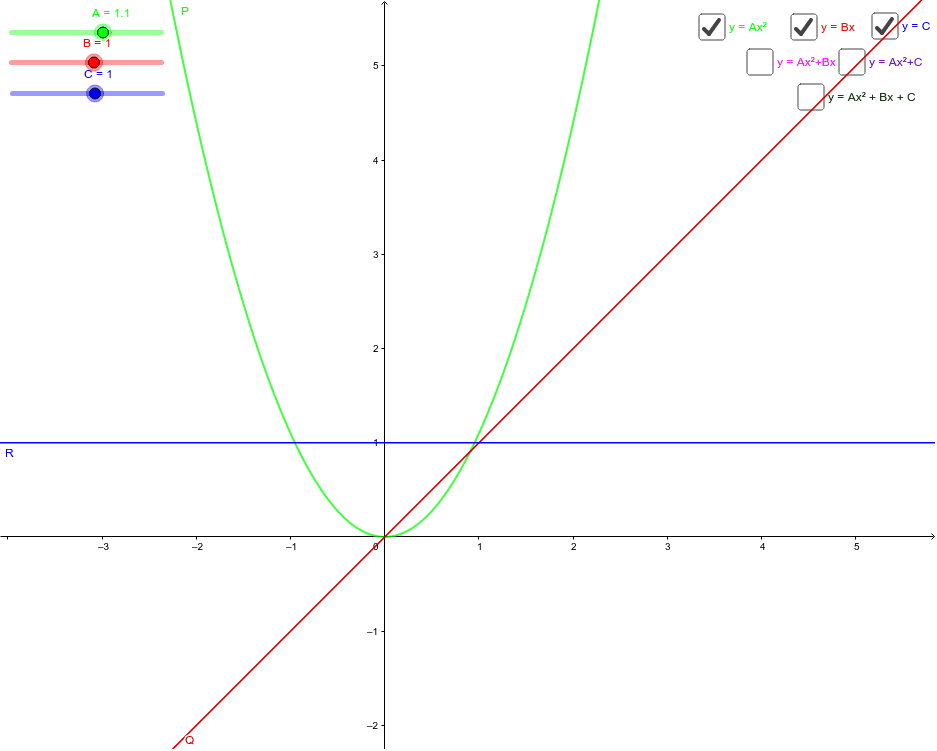
This example demonstrates how the parameters A, B, and C in the quadratic function Ax^2 + Bx + C affect its graph. Key concepts include quadratic functions and coefficient influence. GeoGebra commands used include b, C, A, B, a, c, P, Q, R, F, d, e, S, f, T to construct the function graph. Suitable for high school math education and learning quadratic function properties.
GeoGebra Commands & Parameters
Boolean b(true)Numeric C(1)Numeric A(1.1)Numeric B(1)Boolean a(false)Boolean c(true)P(x) = (A * x^(2))Q(x) = (B * x)R(x) = CF(x) = P(x) + Q(x) + R(x)Boolean d(true)Boolean e(false)S(x) = P(x) + Q(x)Boolean f(false)T(x) = P(x) + R(x)
AI Drawing Prompt Reference
Draw the graph of a quadratic function in standard form, showing how parameters A, B, and C affect the graph. Start by plotting A times x squared, then plot B times x and C separately, and finally add these three parts together to get the complete quadratic function graph. Use sliders to control the values of A, B, and C, and observe their effects on the shape and position of the function graph.
The prompt above was compiled from the original drawing commands and is for reference only.