
Product of Two Linear Functions: Graphical Representation
Loading the math board and drawing, please wait…
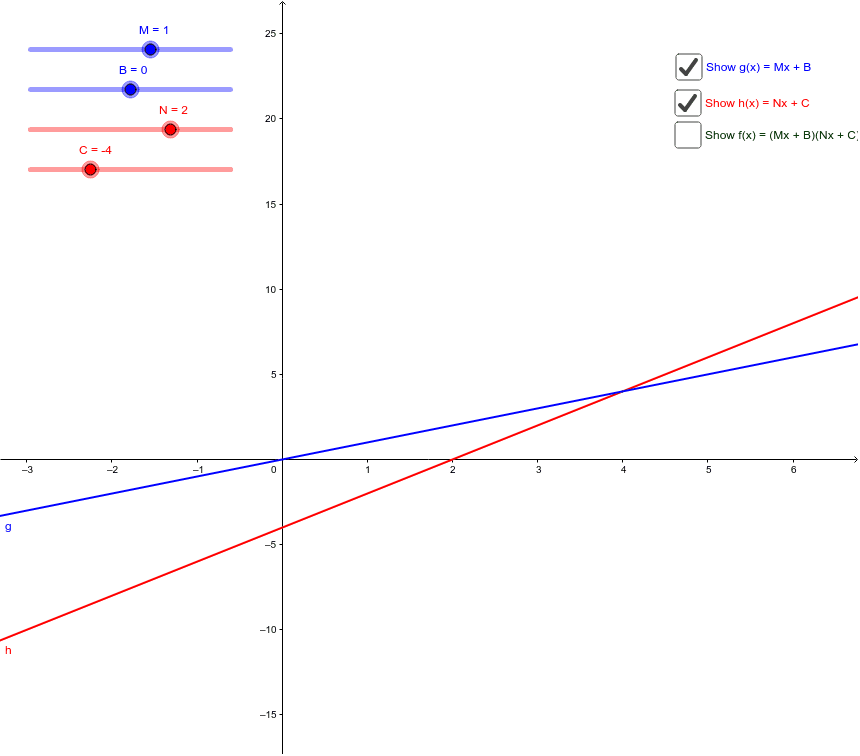
This example demonstrates the graphical representation and behavior of the product of two linear functions. Key math concepts include linear functions, function multiplication, graph transformations, and coordinate geometry. Construction involves GeoGebra commands/objects like b, N, M, B, C, h, g, f, a, c, used for defining functions, calculating intersections, plotting graphs, and adjusting parameters. Suitable for high school students studying function properties, graph transformations, and analytical geometry.
GeoGebra Commands & Parameters
Boolean b(true)Numeric N(2.0)Numeric M(1.0)Numeric B(0.0)Numeric C(-4.0)h(x) = (N * x) + Cg(x) = (M * x) + Bf(x) = (g(x) * h(x))Boolean a(false)Boolean c(true)
AI Drawing Prompt Reference
Graph the product of two linear functions where one has a slope of 2 and y-intercept of -4, and the other has a slope of 1 and y-intercept of 0. Plot the product of these two functions to visualize the resulting graph and its characteristics.
The prompt above was compiled from the original drawing commands and is for reference only.