
Effect of Multiplying by a Constant on the Mean
Loading the math board and drawing, please wait…
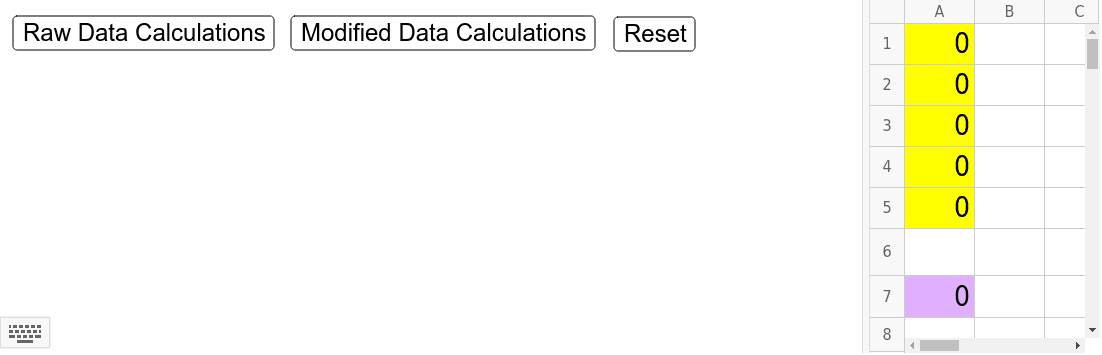
This example demonstrates the impact of multiplying each element in a dataset by a constant on the mean of the data. It involves core mathematical concepts such as mean, statistics, and arithmetic operations. The construction utilizes GeoGebra commands like Sum, Mean, Insert, Length, and TableText, along with objects such as A7, A1, A2, A3, A4, A5, ListTemp1, MyConst, ListTemp2, Headings, SumRaw, SumMod, MeanRaw, MeanMod, ListTemp1A, ListTemp1B, ListTemp2A, ListTemp2B, a, button1, b, button2, button3, nRaw, nMod, ListTemp1C, ListTemp2C, RawData, ModData, text1, and text2. It is suitable for high school students learning statistics and data analysis.
GeoGebra Commands & Parameters
Sum(ListTemp1) → SumRawSum(ListTemp2) → SumModMean(ListTemp1) → MeanRawMean(ListTemp2) → MeanModInsert("Raw Data", ListTemp1, 1) → ListTemp1AInsert(SumRaw, ListTemp1A, 7) → ListTemp1BInsert("Raw Data x Constant", ListTemp2, 1) → ListTemp2AInsert(SumMod, ListTemp2A, 7) → ListTemp2BLength(ListTemp1) → nRawLength(ListTemp2) → nModInsert(nRaw, ListTemp1B, 7) → ListTemp1CInsert(nMod, ListTemp2B, 7) → ListTemp2CInsert(MeanRaw, ListTemp1C, 9) → RawDataInsert(MeanMod, ListTemp2C, 9) → ModDataTableText({Headings, RawData}, "c|_") → text1TableText({Headings, RawData, ModData}, "c|_") → text2
AI Drawing Prompt Reference
Illustrate the effect of multiplying a dataset by a constant on its mean. Start by plotting the original dataset and the dataset multiplied by a constant, then calculate and label the sums and means of both datasets. Insert the sum after the original dataset and after the multiplied dataset, and also insert the lengths of both datasets. Finally, insert the mean of the original dataset after its length and the mean of the multiplied dataset after its length, then display both datasets and their means in table format.
The prompt above was compiled from the original drawing commands and is for reference only.