
Effect on Mean of Adding a Constant
Loading the math board and drawing, please wait…
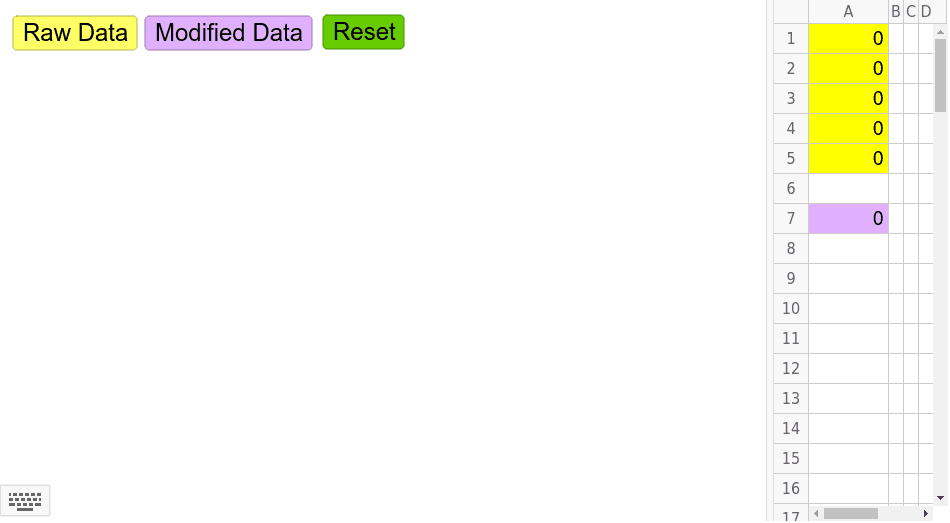
This interactive GeoGebra example demonstrates how adding a fixed constant to every data item in a dataset affects the mean and the sum of the dataset. The core mathematical concept is the property of arithmetic mean and sum: when each data value is increased by a constant c, the total sum increases by n×c (where n is the number of data points), and the mean also increases by c. The construction uses GeoGebra commands such as Sum, Mean, Insert, Length, TableText, and Corner, along with objects like RawData, ModData, MyConst (a slider for the constant), and multiple buttons (button1, button2, button3) to dynamically modify the data or the constant. A table (TableText) displays the original and modified sums, means, and counts. This resource is suitable for middle school or high school statistics lessons, helping students intuitively grasp how data translation affects central tendency, and can also serve as a conceptual demonstration in introductory college statistics courses.
GeoGebra Commands & Parameters
Sum(ListTemp1) → SumRawSum(ListTemp2) → SumModMean(ListTemp1) → MeanRawMean(ListTemp2) → MeanModInsert("Raw Data", ListTemp1, 1) → ListTemp1AInsert(SumRaw, ListTemp1A, 7) → ListTemp1BInsert("Modified Data", ListTemp2, 1) → ListTemp2AInsert(SumMod, ListTemp2A, 7) → ListTemp2BLength(ListTemp1) → nRawLength(ListTemp2) → nModInsert(nRaw, ListTemp1B, 7) → ListTemp1CInsert(nMod, ListTemp2B, 7) → ListTemp2CInsert(MeanRaw, ListTemp1C, 9) → RawDataInsert(MeanMod, ListTemp2C, 9) → ModDataTableText({Headings, RawData}, "c|_") → text1TableText({Headings, RawData, ModData}, "c|_") → text2Corner(5) → ScreenSize