
Dynamic Relationship Between Unit Circle and Sine/Cosine Curves
Loading the math board and drawing, please wait…
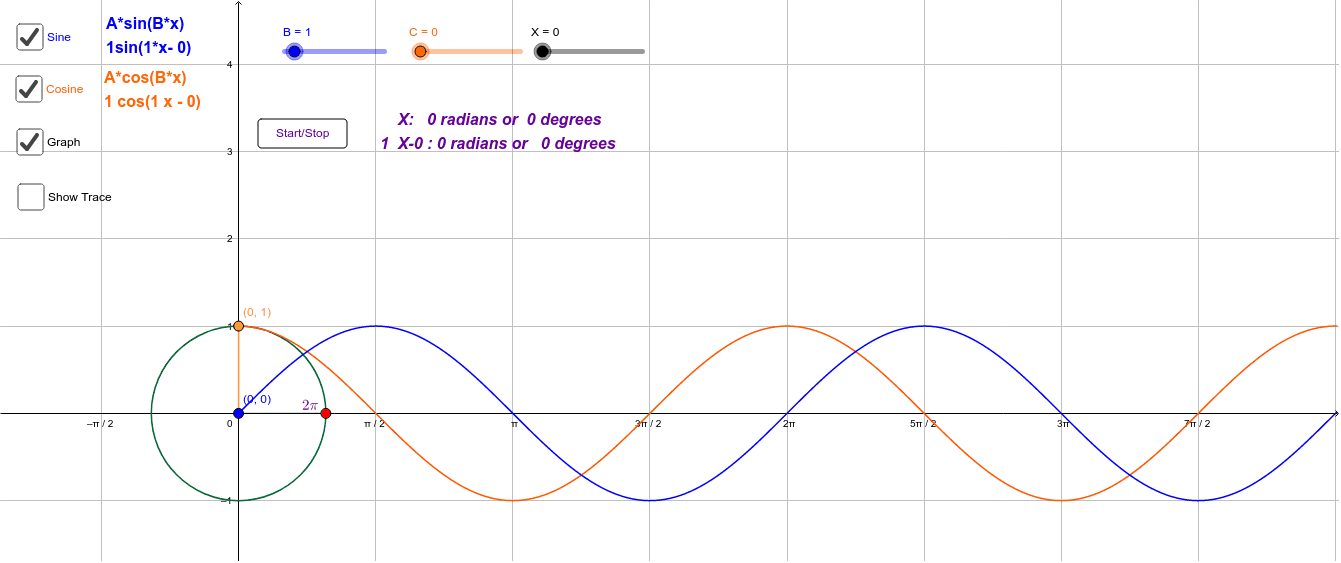
This interactive GeoGebra example demonstrates how a point moving on the unit circle generates the sine and cosine function curves. It visualizes the fundamental trigonometric definitions: for any angle, the x-coordinate of the point on the unit circle equals cosine, and the y-coordinate equals sine. The construction uses commands such as Intersect, Segment, Point, and Angle to define the circle, the moving point, and the connecting segments. Slider animation (button1, anim) controls the angle, while text objects display angle measures in degrees and radians, and the corresponding function values. The projection of the point onto the axes is traced to form the sine and cosine graphs, showing their periodic nature and phase shift. This resource is ideal for high school trigonometry or introductory college mathematics, helping students grasp the geometric origin of trigonometric functions and their graphical representation.
GeoGebra Commands & Parameters
Intersect(xAxis, yAxis) → FSegment(E, F) → f_1Segment(f, I) → gPoint(g) → JPoint(g) → HAngle(J, F, E) → αIntersect(c, f_1, 1) → LIntersect(c, xAxis, 2) → KPoint(c) → PPoint(c) → UPoint(c) → VPoint(c) → TPoint(c) → WPoint(c) → ZPoint(c) → A_1Point(c) → C_1Point(c) → B_1Point(c) → D_1Point(c) → RPoint(c) → SSegment(G, J) → h
AI Drawing Prompt Reference
Draw a unit circle with a point moving along it, showing how its x and y coordinates correspond to cosine and sine functions. Project the point's coordinates onto the axes and trace them to form the cosine and sine curves. Use a slider to control the angle, displaying the angle in degrees and radians along with the function values. Connect the center of the circle to the moving point and draw lines from the point to the axes.
The prompt above was compiled from the original drawing commands and is for reference only.