
Dynamic P-value Calculation for Proportion Test
Loading the math board and drawing, please wait…
In collections
Statistics Demonstrations
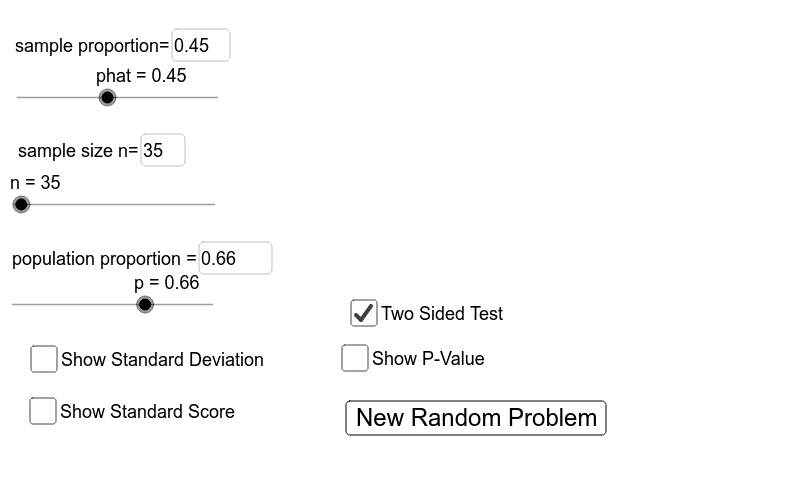
This GeoGebra example provides an interactive demonstration of how to compute the P-value in a hypothesis test for a population proportion. It visually shows how the test statistic (z-score) and the corresponding P-value change as the sample size, sample proportion, and hypothesized proportion are varied. The core mathematical concepts include the normal distribution, standard normal distribution, hypothesis testing, P-value, significance level, and one-tailed/two-tailed tests. Construction highlights: Textfield inputs capture the sample size n, sample proportion phat, and hypothesized proportion p; the Normal command builds the normal distribution; the standard error sd is computed; Min and If commands handle the P-value calculation for two-sided tests; a reset button restores default values; dynamic text displays the z-score and P-value. This resource is suitable for high school or college statistics courses, helping students grasp the meaning and computation of P-values in hypothesis testing, and can also serve as a classroom demonstration tool for instructors.
GeoGebra Commands & Parameters
Textfield(n) → inputBox2Textfield(phat) → inputBox3Textfield(p) → inputBox4Normal(0, 1, zscore) → P1Min(P1, 1 - P1) → P2If(a, (2 * P2), P2) → PIf(a, "two", "one") → sides
AI Drawing Prompt Reference
Create a dynamic graph for calculating the P-value in a proportion test, including a normal distribution curve showing the impact of changes in sample size, sample proportion, and assumed proportion on the z-score and P-value. Use text input boxes to enter sample size n, sample proportion phat, and assumed proportion p, then calculate the standard error and draw the normal distribution curve using the Normal command. Calculate the P-value based on whether it's a two-tailed test and display the z-score and P-value.
The prompt above was compiled from the original drawing commands and is for reference only.