
Dynamic Exploration of Cylinder Symmetry, Derivatives, and Logarithmic Functions
Loading the math board and drawing, please wait…
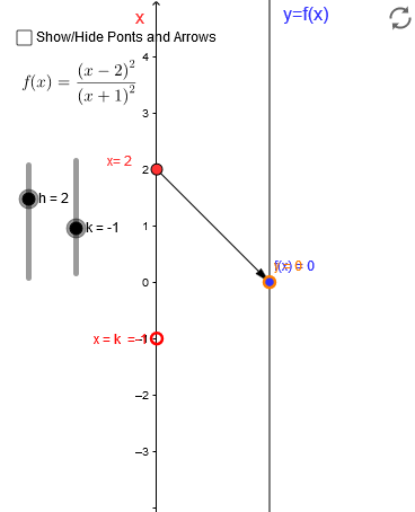
This GeoGebra example demonstrates an interactive exploration of the relationships among cylinder symmetry, standard deviation, derivatives, and logarithmic functions through dynamic input boxes and sliders. The core mathematical concepts include solid geometry (cylinder symmetry), calculus (derivatives and logarithmic functions), probability and statistics (standard deviation), and dynamic transformations of function graphs. The construction uses GeoGebra commands such as Point, Vector, Textfield, and Sequence to create points, vectors, text input fields, and sequences, along with multiple auxiliary objects (A_1, B, G1, H1, etc.) to support the graphical structure. It is suitable for high school to university-level mathematics instruction, helping students visualize the geometric meaning of derivatives, properties of logarithmic functions, cross-sections of cylinders, and the dispersion of data. By adjusting parameters, learners can observe how function changes correlate with geometric symmetry, enhancing intuitive understanding of abstract concepts.
GeoGebra Commands & Parameters
Point(yAxis) → A_1Vector(A_1, B) → uTextfield(f) → inputBox1Sequence(Vector[(0, i), (2, f(i))], i, k - 2, k + 2, 0.25) → list2Sequence((i, f(i)), i, k - 2, k + 2, 0.25) → list1
AI Drawing Prompt Reference
Draw a 3D cylinder with its symmetry axis aligned with the vertical axis, rendered semi-transparent to reveal internal structure. In front of the cylinder, place an interactive text input box for entering a function expression. Along the cylinder's side or nearby, generate a horizontal sequence of small arrows, each pointing from a point on the horizontal axis to the corresponding point on the function curve, arranged at fixed intervals. Simultaneously, mark sample points on the function curve with dots at the same intervals. Include a draggable slider to adjust the center of the sampling range, causing the arrows and points to move dynamically, visually linking function changes to the cylinder's symmetry.
The prompt above was compiled from the original drawing commands and is for reference only.