
Dynamic Expected Value Demonstration with Sine Function and Isosceles Triangles
Loading the math board and drawing, please wait…
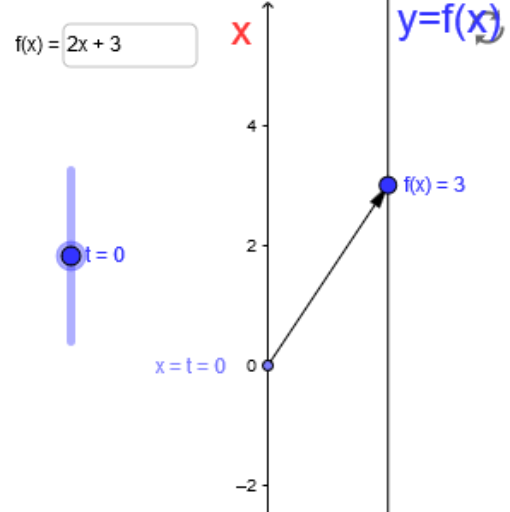
This GeoGebra example interactively demonstrates the relationship between the sine function graph and the geometric properties of isosceles triangles, while introducing the concepts of expected value and arithmetic operations. The core mathematical concepts include sine functions, real number operations, side-length and angle relationships in isosceles triangles, and the calculation of expected values for random variables. The construction uses the Vector command to create vectors, the Textfield command to create text input boxes, and defines objects such as t, A, f, B, u, text1, text2, inputBox1, x_0, f_x, and a. By adjusting parameters through sliders or input fields, users can observe real-time changes in function values and corresponding triangle shapes. This resource is suitable for high school or early college students to understand the interdisciplinary connections among trigonometry, geometry, and probability/statistics, and can also serve as a classroom demonstration tool for teachers to visualize the intrinsic links between mathematical concepts.
GeoGebra Commands & Parameters
Vector(A, B) → uTextfield(f) → inputBox1
AI Drawing Prompt Reference
Create an interactive diagram showing the relationship between the sine function graph and the geometric properties of isosceles triangles. Include a text input box for entering a numerical value, and display the corresponding function value. Use a slider or input field to adjust a parameter, causing a point on the sine curve to move, while this point, the origin, and another fixed point form an isosceles triangle whose side lengths and angles change dynamically. Show a vector arrow from one point to another, and include text labels explaining the concept of expected value. The layout should clearly illustrate the dynamic connections among the curve, triangle, vector, and input box.
The prompt above was compiled from the original drawing commands and is for reference only.