
Dynamic Demonstration of Sample Mean and Standard Deviation
Loading the math board and drawing, please wait…
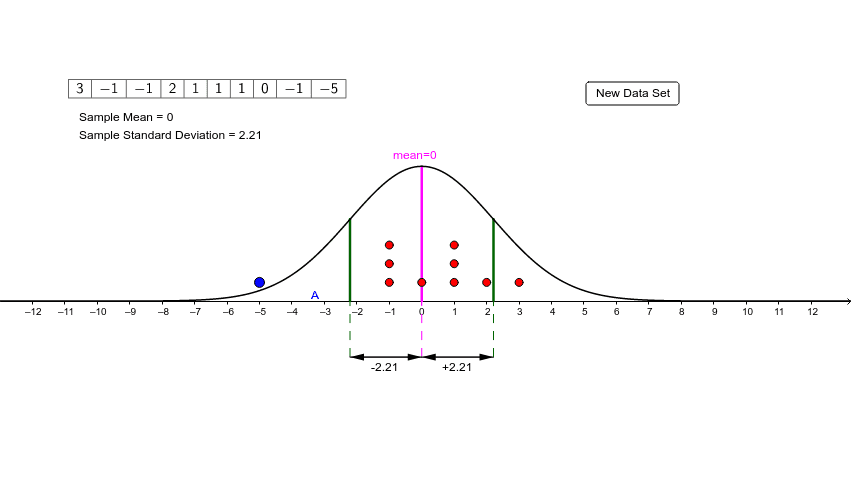
This example dynamically shows how the sample mean and standard deviation change by dragging point A. Key mathematical concepts include sample statistics. Commands used include point, random, sample standard deviation, mean, etc. Suitable for high school statistics courses.
GeoGebra Commands & Parameters
Point(Segment[(-15, 1), (15, 1)]) → ARandom(-3, 3) → A9Random(-3, 3) → A8Random(-3, 3) → A7Random(-3, 3) → A6Random(-3, 3) → A5Random(-3, 3) → A4Random(-3, 3) → A3Random(-3, 3) → A2Random(-3, 3) → A1Append(Sequence[Random[-3, 3] + a - a, a, 1, Random[5, 10]], x(A)) → list1Sort(list1) → list3SampleSD(list4) → sampledevMean(list4) → samplemeanSegment((samplemean, 0), (samplemean, g(samplemean))) → bSegment((samplemean - sampledev, 0), (samplemean - sampledev, g(samplemean - sampledev))) → cSegment((samplemean + sampledev, 0), (samplemean + sampledev, g(samplemean - sampledev))) → dPoint(b) → BSegment((samplemean, (-3)), (samplemean, 0)) → eSegment((samplemean + sampledev, (-3)), (samplemean + sampledev, 0)) → hPoint(e) → CPoint(h) → DMirror(h, e) → h'Mirror(D, C) → D'Vector(C, D) → uVector(D, C) → vVector(C, D') → wVector(D', C) → zMidpoint(D', C) → EMidpoint(C, D) → FDotPlot(list4) → list2TableText({list4}, "c|_") → text1
AI Drawing Prompt Reference
Generate multiple random points on a horizontal line and dynamically display their sample mean and standard deviation. Change the number and position of points by dragging a point on the line, observing how the sample mean (shown as a vertical line) and standard deviation (shown as two parallel lines) change. Also, plot a scatter plot and list of sample points, displaying the coordinates of all sample points.
The prompt above was compiled from the original drawing commands and is for reference only.