
Dynamic Demonstration of Angle Between Two Vectors
Loading the math board and drawing, please wait…
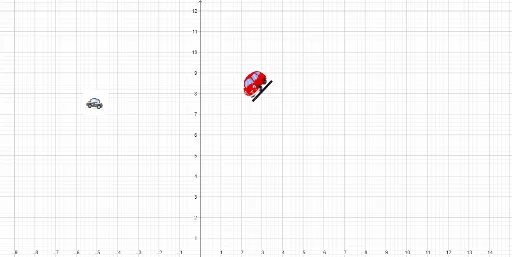
This GeoGebra example dynamically illustrates the angle between two vectors, using polygons, mirror transformations, and auxiliary constructions to visualize vector directions and the magnitude of the included angle. Core mathematical concepts include vector definition, angle calculation, geometric transformations (mirroring), and polygon properties. The construction employs commands such as Segment to create vector lines, Point to define key vertices, and Mirror to generate symmetric figures, involving multiple objects (A, B, C, D, E, F, G, H, pic1, pic2, etc.) to build a rich visual context. Suitable for high school or early college students learning vector geometry and spatial orientation, and for teachers demonstrating the relationship between vector angles and geometric transformations in class.
GeoGebra Commands & Parameters
Segment(A, B) → fSegment(C, D) → gPoint(g) → EMirror(pic1, E) → pic1'Segment(D, C) → hSegment(G, D) → iPoint(i) → HMirror(pic2, H) → pic2'
AI Drawing Prompt Reference
Draw two vectors and dynamically illustrate the angle between them using polygons and mirror transformations to visualize vector directions and the magnitude of the included angle. Start by drawing line segments to represent the vectors, define key points on the segments, generate symmetric figures through mirror transformations, and use polygons to assist in showing vector directions and the angle relationship, demonstrating vector geometry and spatial orientation dynamically.
The prompt above was compiled from the original drawing commands and is for reference only.