
Dynamic Demo of Orthocenter and Incircle
Loading the math board and drawing, please wait…
This example dynamically demonstrates the relationship between the orthocenter, incircle, and the Pythagorean theorem and trigonometric functions in right triangles. Key concepts include orthocenter, incircle, Pythagorean theorem, trigonometric functions, and bar charts. Construction involves commands like Point, Vector, Textfield, Sequence, Segment to draw the triangle, orthocenter, and incircle, with bar charts for data visualization. Suitable for high school mathematics education, combining geometric properties with function graphs.
GeoGebra Commands & Parameters
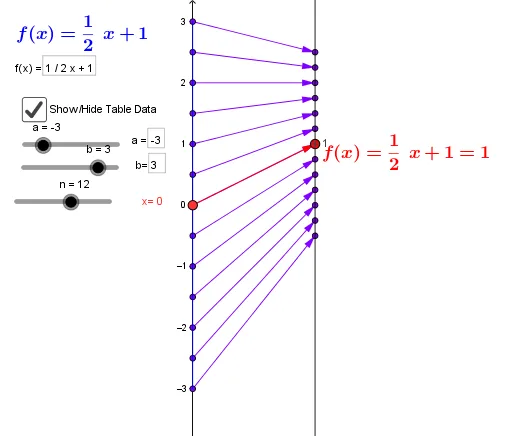
Point(yAxis) → A_1Vector(A_1, B) → uTextfield(f) → inputBox1Textfield(f) → inputBox2Textfield(a) → inputBox3Textfield(b) → inputBox4Sequence((k, f(k)), k, a, b, Δx) → GraphptsSequence(Vector[(0, k), (2, (y_{zoom} * f(k)))], k, a, b, Δx) → MDSequence((0, k), k, a, b, Δx) → SourcePtsMDSequence((2, (y_{zoom} * f(k))), k, a, b, Δx) → TargPts_1Segment((0, a), (0, b)) → c