
Dynamic Correlation Coefficient: Interactive Scatter Plot and Fit Line
Loading the math board and drawing, please wait…
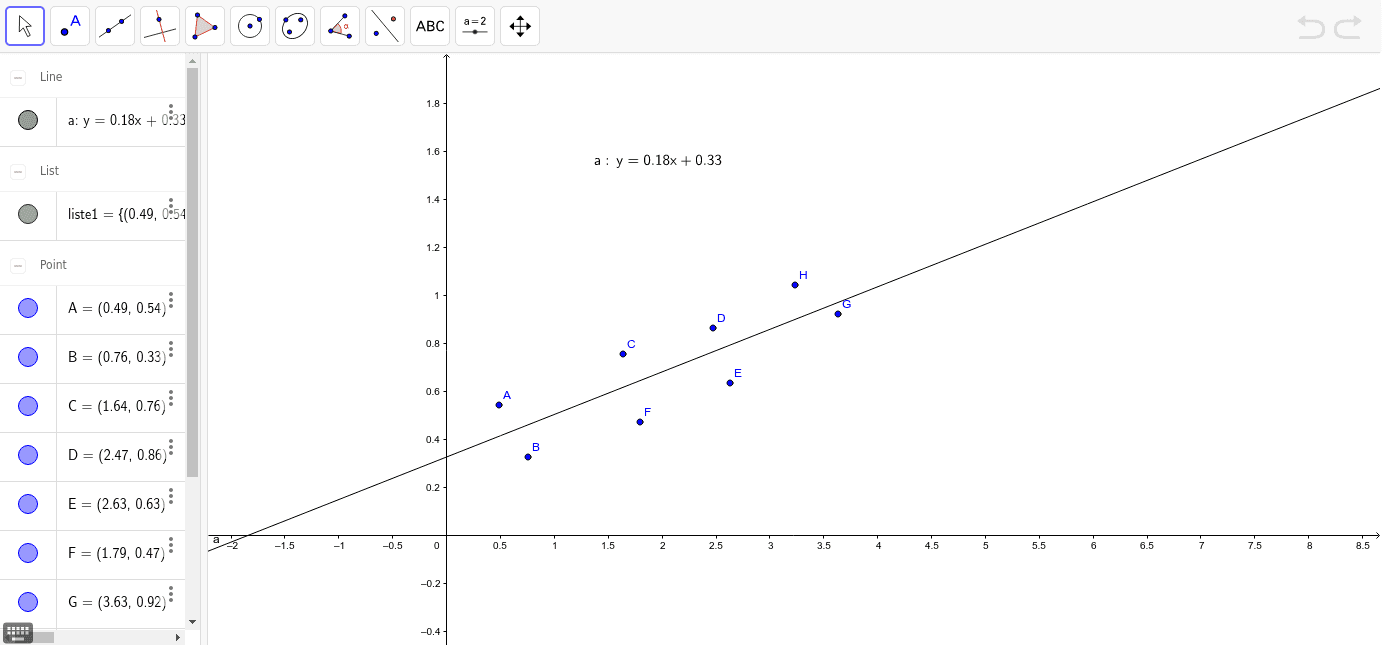
① This example demonstrates how a dynamic slider controls data point distribution, updating the scatter plot, fitted line, and correlation coefficient in real time, revealing the changing strength of linear association between variables. ② Core mathematical concepts include Pearson correlation coefficient, linear regression (least squares), data distribution and continuity, supplemented by boxplot, histogram, and cosine function visualizations. ③ Construction highlights: uses GeoGebra's FitLineY command to generate the regression line, manages data points via a list (liste1), employs a slider (a) for dynamic adjustment, and displays the correlation value using LaTeX text (metin1); objects A through H are draggable points for interactive modification. ④ Suitable for high school to university-level statistics and data analysis teaching, ideal for demonstrating the intuitive relationship between correlation and regression, helping students understand how outliers or data distribution affect the correlation coefficient, and useful for classroom demonstrations or self-directed exploration.
GeoGebra Commands & Parameters
FitLineY(liste1) → aLaTeX(a, true, true) → metin1
AI Drawing Prompt Reference
Create a dynamic scatter plot and fitted line where the distribution of data points can be adjusted using a slider, updating the scatter plot, fitted line, and correlation coefficient in real time to show the changing strength of the linear association between variables. Manage data points with a list and use a slider to dynamically adjust, displaying the correlation coefficient value.
The prompt above was compiled from the original drawing commands and is for reference only.