
Normal Distribution Histogram
Loading the math board and drawing, please wait…
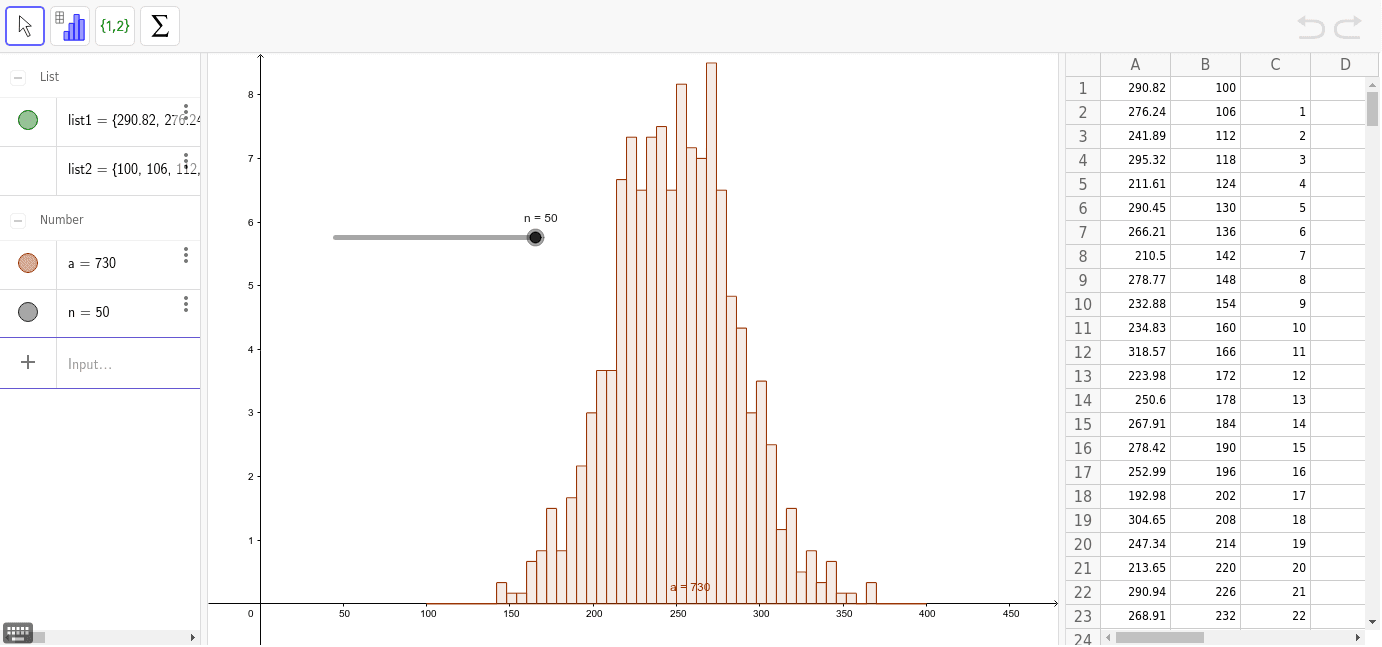
This example demonstrates the construction and characteristics of a normal distribution histogram using GeoGebra. It involves core math concepts like normal distribution, probability density function, histogram, and special points (mean, median, mode). The construction uses the Histogram command with data points A1 to A40. Suitable for high school and above students learning probability statistics and data analysis, or for statistical education demonstrations.
GeoGebra Commands & Parameters
Histogram(list2, list1) → a
AI Drawing Prompt Reference
Create a histogram representing a normal distribution using 40 data points, highlighting the mean, median, and mode as special points located at the peak of the distribution. The bars should be smooth and connected, illustrating the probability density function's shape. The overall graph must clearly show the symmetry and central tendency characteristic of a normal distribution.
The prompt above was compiled from the original drawing commands and is for reference only.