
Dynamic Construction of the Sine Graph with Geometric Connections
Loading the math board and drawing, please wait…
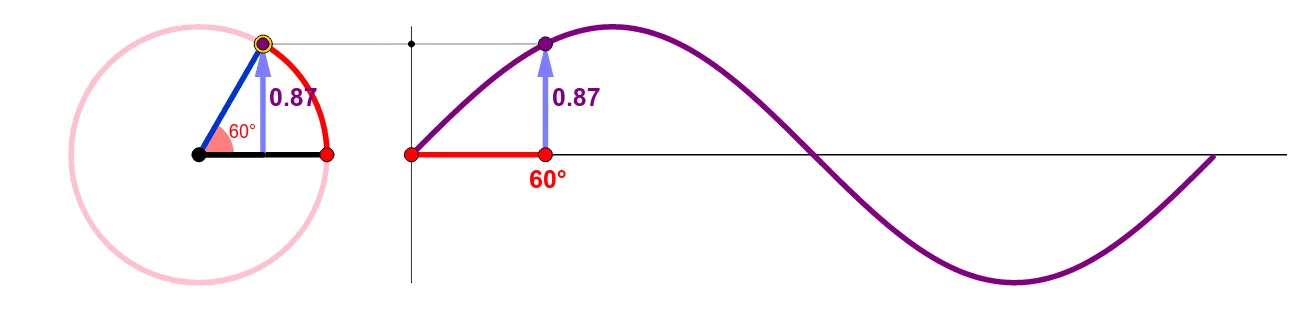
This GeoGebra example dynamically demonstrates the generation of the sine function graph by linking the angle on the unit circle to points on the curve. Core mathematical concepts include trigonometric functions (sine), angles, similar triangles, circles and arcs, loci, and function graphing. Construction highlights: commands such as Point, Circle, Angle, Segment, Arc, Locus, CurveCartesian, Vector, Intersect, and Text are used to build the unit circle, angle measures, and the sine curve, with labeled objects for clarity. Suitable for high school or introductory college students learning about sine graphs, radian measure, and function transformations, as well as exploring periodicity and geometric interpretations.
GeoGebra Commands & Parameters
Point(xAxis) → ACircle(A, B) → cPoint(c) → PAngle(B, A, P) → αAngle(B, A, D) → θSegment(A, D) → fArc(c, B, D) → tSegment(F, G) → hLocus(H, P) → loc1Vector(E, D) → gVector(G, H) → iCurveCartesian(0, t, t, -1, 1) → aSegment(A, B) → jSegment(P, H) → kIntersect(k, a) → IText(y(D), J + (0.03, -0.05)) → text2Text(y(D), J + (0, -0.05) + Corner[text2, 1] - Corner[text2, 2]) → text4Text(y(D), J + (0.05, -0.05)) → text5Segment(E, A) → lText(y(D), J + (0.05, -0.05) + (k, 0)) → text3