
Sine Graph with Unit Circle Dynamic Demonstration
Loading the math board and drawing, please wait…
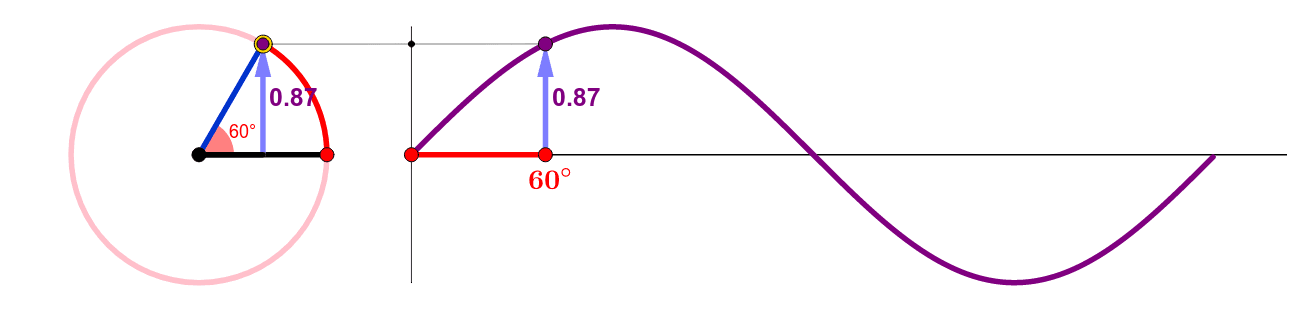
①This example visually demonstrates how the sine function graph is generated by linking a moving point on the unit circle to its corresponding point on the sine curve, connecting angle changes to function values. ②Core mathematical concepts include trigonometric functions (sine and cosine), the unit circle, angle-radian correspondence, and the locus of function graphs. ③Construction highlights: using GeoGebra commands such as Point, Circle, Angle, Segment, Arc, Locus, Vector, CurveCartesian, and Text, it builds a unit circle, angle α, moving point P, and generates the sine curve f via Locus, with text labels for key points and values, enabling dynamic interaction. ④Suitable for high school trigonometry lessons, pre-calculus review, and math enthusiasts exploring the geometric intuition behind function graphs, as well as for teachers creating interactive materials.
GeoGebra Commands & Parameters
Point(xAxis) → ACircle(A, B) → cPoint(c) → PAngle(B, A, P) → αAngle(B, A, D) → θSegment(A, D) → fArc(c, B, D) → tSegment(F, G) → hLocus(H, P) → loc1Vector(E, D) → gVector(G, H) → iCurveCartesian(0, t, t, -1, 1) → aSegment(A, B) → jSegment(P, H) → kIntersect(k, a) → IText(y(D), J + (0.03, -0.05)) → text2Text(y(D), J + (0, -0.05) + Corner[text2, 1] - Corner[text2, 2]) → text4Text(y(D), J + (0.05, -0.05)) → text5Segment(E, A) → lText(y(D), J + (0.05, -0.05) + (k, 0)) → text3