
Dual Parallel Number Lines Demonstration
Loading the math board and drawing, please wait…
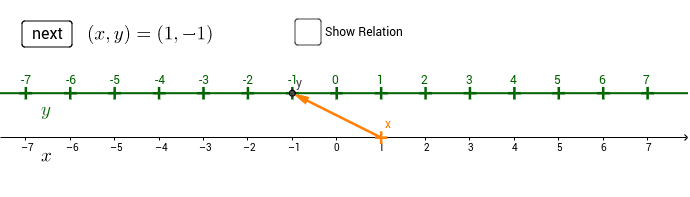
This example demonstrates how to visualize the coordinate plane using two parallel number lines, highlighting the challenges in observing relationships. It involves core math concepts like equations, secant lines, power functions, logic, triangles, and function graphs. The construction utilizes GeoGebra commands such as Sequence, Zip, Point, Element, and Vector, along with objects like xmin, xmax, ptsList, and f. Suitable for middle school students and above for understanding basic analytical geometry, or as a teaching aid for university-level math visualization.
GeoGebra Commands & Parameters
Sequence((xx, 1), xx, xmc, xmax, 1) → ptsListZip(Text[x(pt), pt + (-0.1, 0.2)], pt, ptsList) → list2Point(xAxis) → AElement(flist, nf) → fnVector(A, B) → u
AI Drawing Prompt Reference
Draw two parallel number lines, one horizontal and the other vertical. On the horizontal line, mark points from xmc to xmax with an interval of 1 unit. Then label these points on the vertical line with their coordinates. Next, draw a function graph with different colors for different function segments. Finally, draw a vector starting from the origin.
The prompt above was compiled from the original drawing commands and is for reference only.