
Composition of Core Linear Functions
Loading the math board and drawing, please wait…
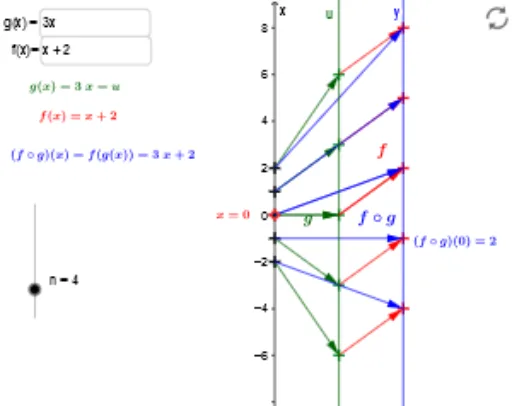
This example demonstrates the composition of two core linear functions and the resulting changes in their graphs. It involves key mathematical concepts such as function composition, properties of linear functions, and analytical geometry. The construction uses commands like Point, Vector, Textfield, Sequence, and Zip to create function graphs, vectors, text fields, and sequences. Suitable for high school mathematics instruction to understand the geometric and algebraic meaning of function composition.
GeoGebra Commands & Parameters
Point(yAxis) → AVector(A, B) → uVector(B, C) → vTextfield(g) → inputBox1Textfield(f) → inputBoxfVector(A, C) → wSequence(0, n) → NZip((0, y(A) - n / 2 + s), s, N) → x_nZip(Vector[A, B], A, x_n, B, gx_n) → xu_nZip(Vector[A, B], A, gx_n, B, fgx_n) → uy_nZip(Vector[A, B], A, x_n, B, fgx_n) → xy_n
AI Drawing Prompt Reference
Draw a coordinate plane with the y‑axis and place point A on it. Choose points B and C and draw vectors u from A to B, v from B to C, and w from A to C. Add two text fields for entering the linear functions f(x) and g(x). Create a sequence of equally spaced values from 0 to n along the x‑direction. For each value, draw vectors on line AB that illustrate the action of f, the action of g, and their composition.
The prompt above was compiled from the original drawing commands and is for reference only.