
Drawing the Line: Graphing via Points
Loading the math board and drawing, please wait…
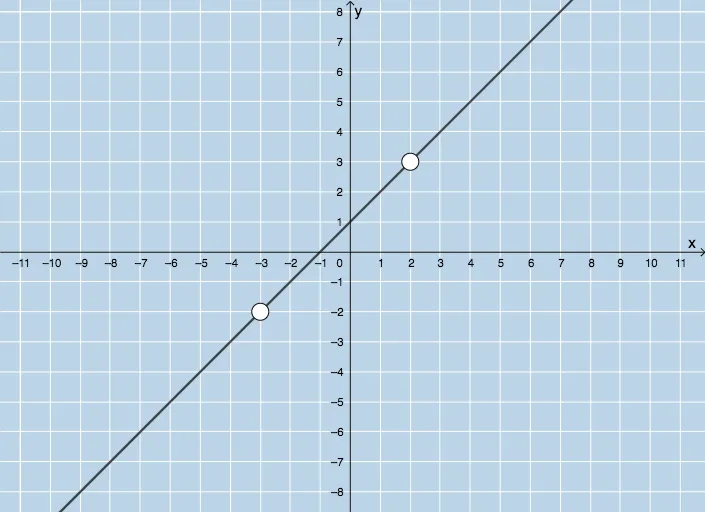
This example demonstrates how to graph a straight line on the Cartesian plane using given points, and dynamically shows the relationship between the line's equation and its graph. Core mathematical concepts include linear equations, coordinate geometry, slope and intercept, and the principle that two points determine a line. Construction highlights: GeoGebra commands such as Random generate random points, Line connects two points to form the line, Point marks key locations, Textfield and InputBox allow interactive input, Circle and Intersect assist in auxiliary constructions, FractionText displays equations as fractions, and buttons (button1, button2) control dynamic updates. Suitable for middle and high school students learning algebra and analytic geometry, as well as for teachers demonstrating the correspondence between linear equations and their graphs in class.
GeoGebra Commands & Parameters
Random(-6, 6) → aRandom(-6, 6) → bLCM(a, b) → cRandom(1, 4) → kLine(A, B) → gTextfield(h) → InputBox1Textfield(j) → InputBox2Textfield(m) → InputBox3Point(f) → CCircle(C, 2) → pIntersect(p, f, 2) → DFractionText(h) → text6
AI Drawing Prompt Reference
On a Cartesian plane, generate two sets of random coordinate values and use them to define a straight line by connecting the two key points. Also place a circle with a fixed radius centered at one of these points, then determine an additional intersection point between the circle and the line implied by the current inputs. Include three input fields for the parameters that control the line’s equation, and display the corresponding key expression in fractional form. Update the graph so the line, the circle, and the intersection point reflect the user’s entered values.
The prompt above was compiled from the original drawing commands and is for reference only.