
Drawing the Equation of a Line
Loading the math board and drawing, please wait…
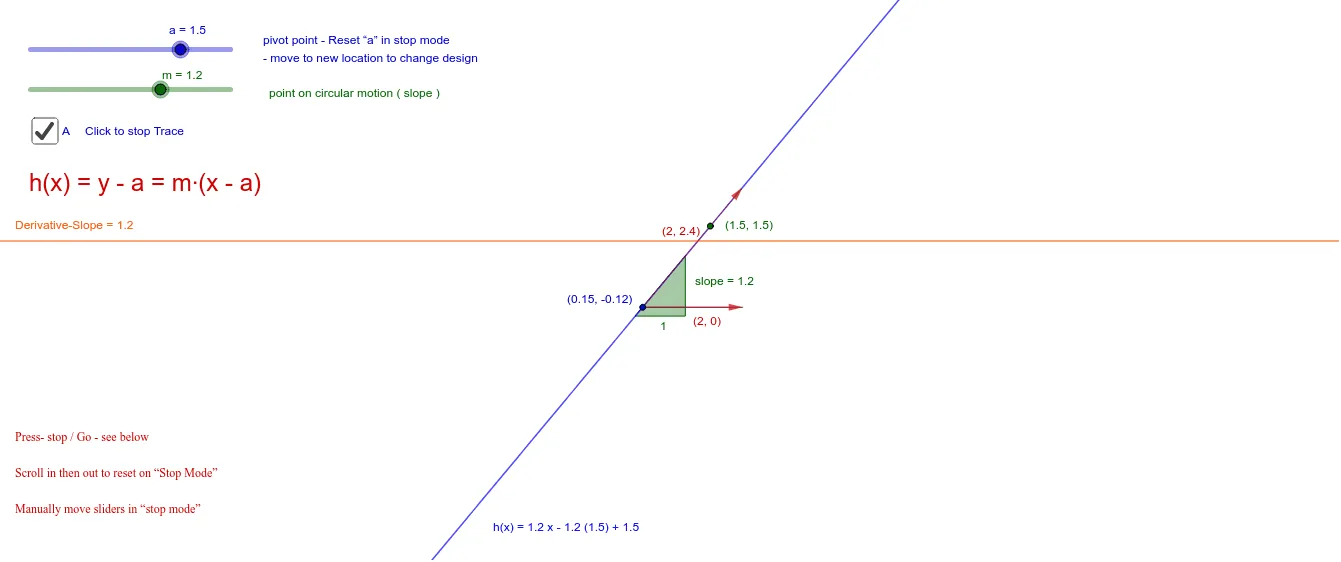
This example demonstrates how to draw a line equation and show parameter variations. It involves core math concepts like linear equations, slope, points, and vectors. Construction highlights include using commands/objects like Slope, Point, Segment, Vector, Angle in GeoGebra. Suitable for high school mathematics learning and exploration of line equation properties.
GeoGebra Commands & Parameters
Slope(f) → slopePoint(f) → APoint(Circle[A, 2]) → BSegment(A, B) → gPoint(f) → CVector(A, B) → uVector(A, C) → vAngle(g, f) → α