
Drain Rate and Derivatives
Loading the math board and drawing, please wait…
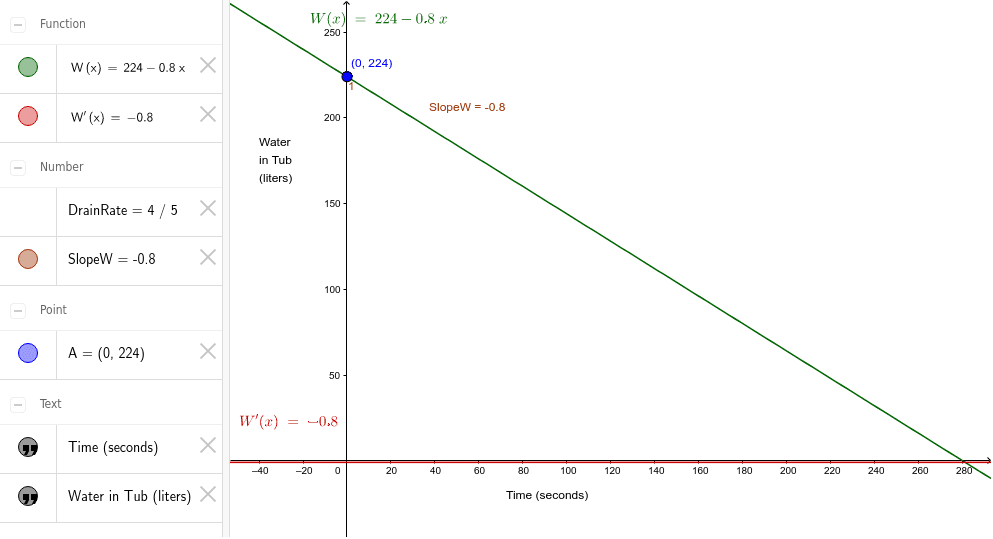
This example demonstrates the relationship between the drain rate and time, involving concepts of derivatives and logarithmic functions. By adjusting the slider, you can observe the changes in the drain rate. The Slope command is used to calculate the slope, and objects like W and W' represent the changes in the drain rate. Suitable for high school math education and learning derivative concepts.
GeoGebra Commands & Parameters
Slope(W) → SlopeW
AI Drawing Prompt Reference
Draw a graph showing the relationship between drain rate and time, involving concepts of derivatives and logarithmic functions. Adjust the slider to observe changes in the drain rate, use the slope command to calculate the slope, and let W and W' represent changes in the drain rate.
The prompt above was compiled from the original drawing commands and is for reference only.