
Doubles or Evens
Loading the math board and drawing, please wait…
In collections
Probability & Intro. to Stat.
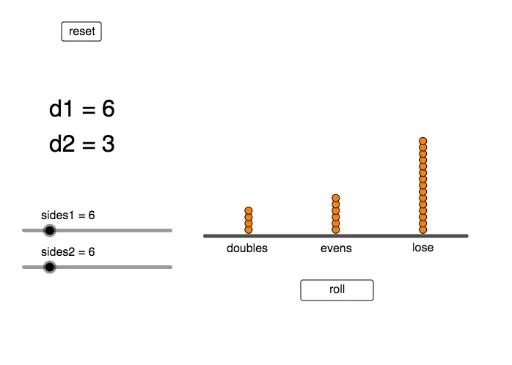
This example demonstrates how to generate random numbers and determine if they are doubles or evens. It involves probability and statistics, as well as sequences. It uses GeoGebra commands such as Sequence, RandomElement, Join, Segment, and DotPlot. Suitable for middle school and above students to learn about probability, statistics, and sequences.
GeoGebra Commands & Parameters
Sequence(a, a, 1, sides1) → d1Sequence(a, a, 1, sides2) → d2RandomElement(d1) → r1RandomElement(d2) → r2Join({Sequence[1, a, 1, doubles], Sequence[2, a, 1, evens], Sequence[3, a, 1, lose]}) → L_1Segment((0.5, 0), (3.5, 0)) → fDotPlot(L_1, false, 0.2) → L_2
AI Drawing Prompt Reference
Create a probability chart for doubles and evens. First, generate two random number sequences, one for doubles and one for evens. Then, randomly select one number from each sequence and record the results. Next, create a sequence containing doubles, evens, and losers, and plot a bar chart to display these results.
The prompt above was compiled from the original drawing commands and is for reference only.