
Dot Plot Activity: Exploring Mean, Median, and Data Distribution
Loading the math board and drawing, please wait…
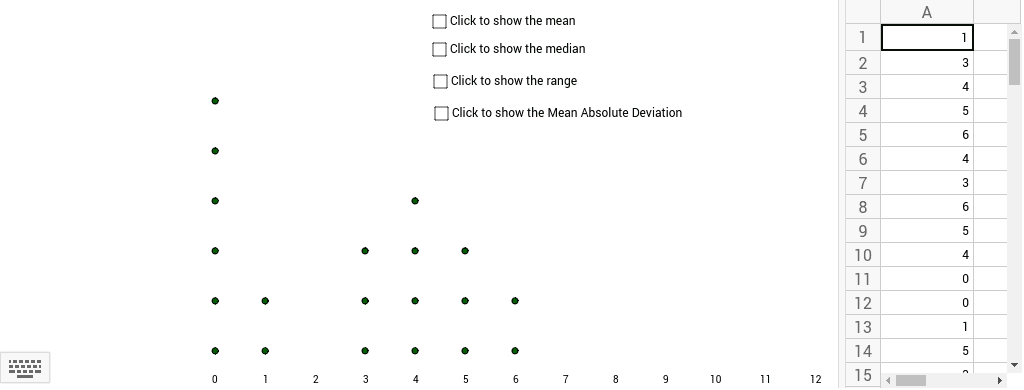
This activity demonstrates how to visualize data distribution using histograms and calculates key statistics like mean, median, range, and mean absolute deviation. Students learn to construct these graphs using GeoGebra commands such as DotPlot and statistical functions. Suitable for middle school students in statistics education, providing a practical approach to understanding data analysis.
GeoGebra Commands & Parameters
DotPlot(A1:A20) → list1Mean(A1:A20) → B1Median(A1:A20) → aMedian(A1:A20) → bMedian(A1:A20) → cMedian(A1:A20) → C1Mean(F1:F20) → G1
AI Drawing Prompt Reference
Create a graph showing data distribution with a dot plot as the main feature. Include horizontal lines representing the mean and median, and label their values. The dot plot should clearly display the data distribution, with the mean and median lines indicating their relative positions. The graph should visually represent how the data is spread out and where the mean and median fall within the distribution.
The prompt above was compiled from the original drawing commands and is for reference only.