
Dot Plot Tool for Up to 30 Statistical Values
Loading the math board and drawing, please wait…
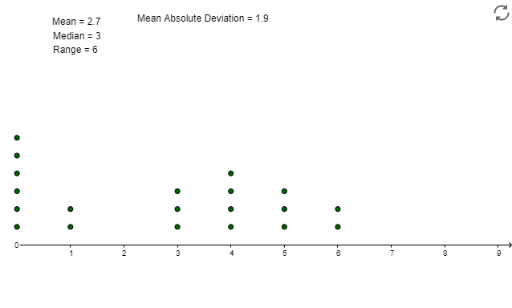
This GeoGebra example demonstrates a dot plot tool that visualizes up to 30 numerical values as points along a number line, allowing users to observe data distribution, frequency, and basic statistical characteristics at a glance. The core mathematical concepts covered include descriptive statistics, measures of central tendency (mean and median), and data visualization through dot plots. Construction relies on GeoGebra commands such as DotPlot, Mean, and Median, applied to objects including data points A1–A20, the list object list1, auxiliary parameters a, b, c, B1, and text/calculation objects C1, D1, E1–E10. By combining list-based input with statistical commands, the tool dynamically generates dot plots and displays the mean and median alongside the raw data. It is suitable for middle school and high school statistics and probability courses, as well as introductory data visualization lessons and self-directed student exploration.
GeoGebra Commands & Parameters
DotPlot(A1:A20) → list1Mean(A1:A20) → B1Median(A1:A20) → aMedian(A1:A20) → bMedian(A1:A20) → cMedian(A1:A20) → C1Mean(F1:F20) → G1
AI Drawing Prompt Reference
Create a dot plot that can display up to thirty numerical values, placing each data point along a horizontal axis so that stacked dots show frequency. Mark the mean and median on the same axis, using distinct symbols or colors for each, and include text labels that give the numeric values of the mean and median. The plot should make the overall distribution, central tendency, and spread immediately visible.
The prompt above was compiled from the original drawing commands and is for reference only.