
Area Model for Fractions/Probability
Loading the math board and drawing, please wait…
In collections
Fraction worksheets
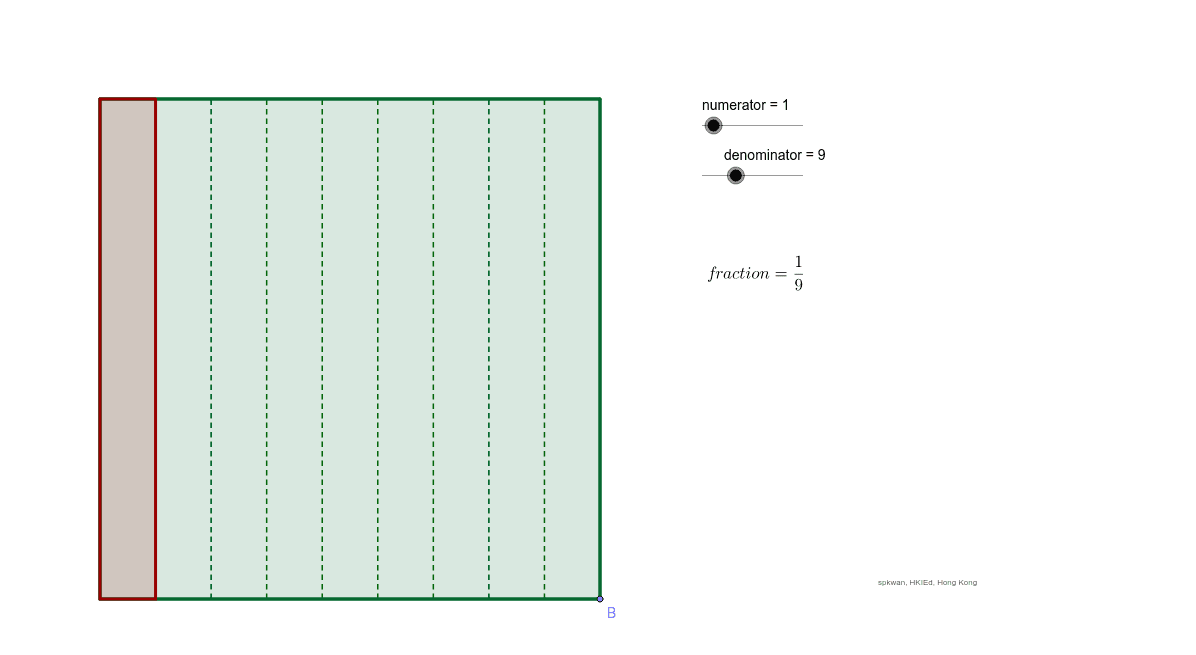
This example uses an area model to demonstrate the concepts of fractions and probability. It shows how to use geometric shapes to represent the multiplication of fractions and probability events. The construction summary indicates that the model uses commands such as Intersect, Point, Polygon, and Sequence. Suitable for middle school and above students to learn fraction multiplication and probability calculation.
GeoGebra Commands & Parameters
Intersect(xAxis, yAxis) → APoint(xAxis) → BPolygon(A, B, 4) → poly1, a, b, c, d, C, DSequence((x(A) + (p * i), y(A)), i, 1, denominator) → list1Sequence((x(D) + (p * j), y(D)), j, 1, denominator) → list2Sequence(Segment[Element[list1, k], Element[list2, k]], k, 1, denominator) → list3Polygon(A, E, F, D) → poly2, a_1, e, f, d_1
AI Drawing Prompt Reference
Create an area model for teaching fractions and probability. Start by placing a point at the origin and another on the x-axis, then construct a square using these two points as adjacent vertices. Divide the bottom and top edges of the square into equal segments according to the denominator, and connect corresponding points with vertical line segments to form a grid. Inside the grid, highlight a smaller rectangle whose side lengths correspond to the numerator and denominator proportions, using a distinct fill color to represent the product of fractions. The final diagram should clearly show the grid divisions and the highlighted area.
The prompt above was compiled from the original drawing commands and is for reference only.