
Division of Functions - Asymptotes
Loading the math board and drawing, please wait…
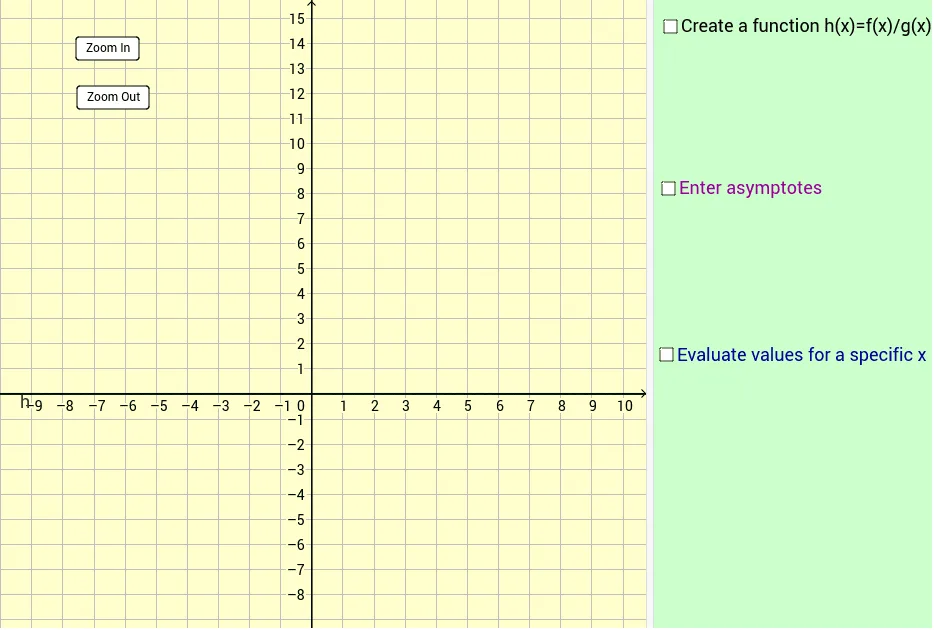
This example demonstrates the graph of the division of two functions and its asymptotes. Key math concepts include function division, asymptotes, and analytical geometry. It uses GeoGebra commands like Textfield, TableText, and objects such as deltaX, a, g, f, h, asymptote_1, A15, B15, A14, C14, inputBox1, asymptote_2, b, c, inputBox2, inputBox3, inputBox4, inputBox5, inputBox6, inputBox7, e, text2, B14, C15, D14, D15, j, k, d, scale, button1, button2, A16, A17, A18, A19, B16, B17, B18, B19 for construction. Suitable for high school and above learning calculus and function graphing.
GeoGebra Commands & Parameters
Textfield(a) → inputBox1Textfield(b) → inputBox2Textfield(c) → inputBox3Textfield(asymptote_1) → inputBox4Textfield(asymptote_2) → inputBox5Textfield(f) → inputBox6Textfield(g) → inputBox7TableText({{A14, B14, C14, D14}, {A15, B15, C15, D15}, {A16, B16, C16, D16}, {A17, B17, C17, D17}, {A18, B18, C18, D18}, {A19, B19, C19, D19}}, "|_") → text3Textfield(deltaX) → inputBox8
AI Drawing Prompt Reference
Graph the division of two functions and its asymptotes, demonstrating key concepts like function division, asymptotes, and analytical geometry. Include input boxes for setting function parameters and asymptote positions, and a table displaying function values. First plot the function graph and asymptotes, then adjust parameters via input boxes, and finally show function values at different points in the table.
The prompt above was compiled from the original drawing commands and is for reference only.