
Distance Between Parabolas
Loading the math board and drawing, please wait…
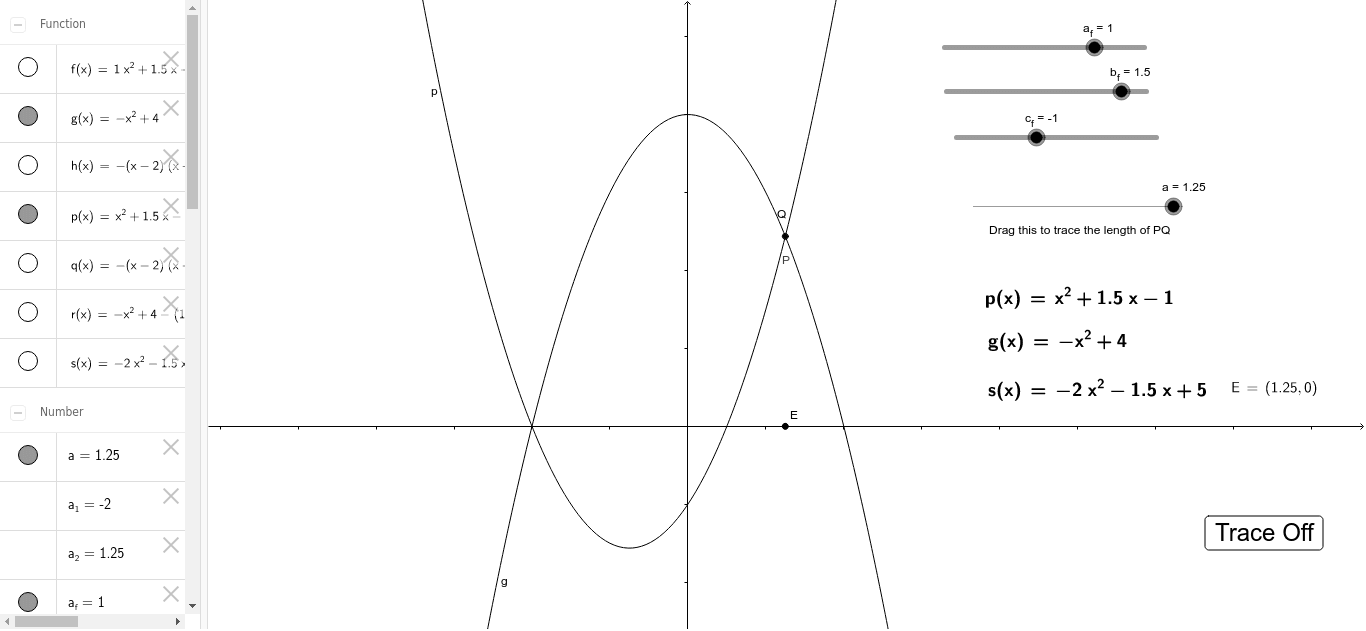
This example demonstrates how to find the shortest distance between two parabolas, visually showing the position of the distance segment as parameters change. Core mathematical concepts include quadratic functions, extrema, distance formulas, and optimization under inequality constraints. Construction highlights: using GeoGebra commands such as Point, Intersect, Segment, Extremum, Polynomial, and LaTeX to define the parabolas and their intersections, with sliders and buttons to control parameters, and auxiliary circles, ellipses, and lines to aid analysis. Suitable for high school and above for learning analytic geometry, function optimization, or introductory calculus, and useful for classroom demonstrations or student exploration. The construction involves objects like h, a_f, b_f, c_f, f, a_2, a_1, A, B, C, a, P, Q, b, D, q, E, a_h, b_h, c_h, button1, text1, g, R, c, p, text3, text2, F, text4, text5, r, s, text6, showing rich interactivity.
GeoGebra Commands & Parameters
Point(f) → AIntersect(f, h) → B, CSegment(Q, P) → bExtremum(h(x) - f(x)) → DPolynomial(h) → gSegment(R, P) → cPolynomial(f) → pLaTeX(p, true, true) → text3LaTeX(E, true, true) → text2Extremum(q) → FLaTeX(p, true, true) → text4LaTeX(g, true, true) → text5Polynomial(r) → sLaTeX(s, true, true) → text6
AI Drawing Prompt Reference
Draw two parabolas, one with equation f(x)=ax^2+bx+c and the other with h(x)=ax^2+bx+c, where a, b, and c are adjustable parameters. Find the shortest distance between these two parabolas and display the distance segment. Use auxiliary circles, ellipses, and lines to aid analysis. Set sliders and buttons to control the position and shape of the parabolas.
The prompt above was compiled from the original drawing commands and is for reference only.