
Quadratic Function Parameters a, b, c Change
Loading the math board and drawing, please wait…
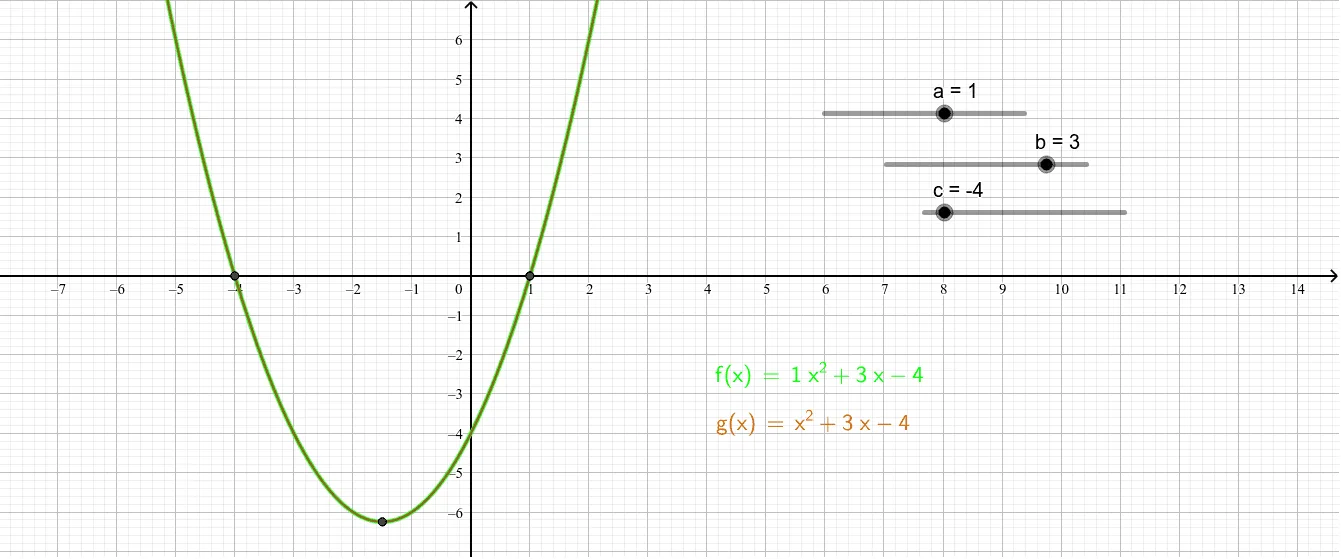
This example demonstrates the dynamic effect of quadratic function graphs as parameters a, b, c change. It involves core math concepts like quadratic functions, parabolas, function graph transformations, and the impact of parameters. GeoGebra commands used include Root (find roots), Extremum (find extrema), LaTeX (formula display), and Intersect (find intersections). Suitable for high school mathematics teaching to understand how parameters affect the shape and position of quadratic function graphs.
GeoGebra Commands & Parameters
Root(f) → A, DRoot(f) → B, EExtremum(f) → CLaTeX(f, true, true) → text1LaTeX(g, true, true) → text2Intersect(f, g, 1) → FIntersect(f, g) → GIntersect(f, g, 1) → HIntersect(f, g, 1) → IIntersect(f, g, 1) → JExtremum(g) → KRoot(g) → L, M
AI Drawing Prompt Reference
Draw a dynamic graph showing how quadratic function parameters a, b, c affect the shape and position of the parabola, including its vertex, x-intercepts, and intersections with another function, with the function formulas displayed, to illustrate the impact of parameter changes.
The prompt above was compiled from the original drawing commands and is for reference only.