
Discontinuous Derivative Demonstration
Loading the math board and drawing, please wait…
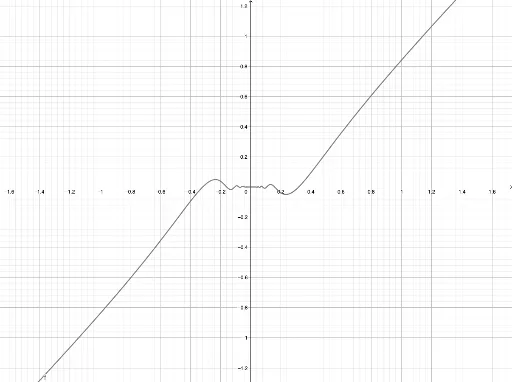
This example demonstrates the graphical representation of a function and its discontinuous derivative. Through visualization, it clearly illustrates the impact of discontinuities on the function's graph. The core mathematical concepts involved include derivatives, function graphs, and limits. The construction highlights the use of the GeoGebra NDerivative command to compute the derivative and display its discontinuity. Suitable for high school and above students to learn and understand the concept of derivatives in calculus, as well as the geometric meaning of function graphs.
GeoGebra Commands & Parameters
NDerivative(f) →NDerivative(f) →NDerivative(f) →NDerivative(f) →NDerivative(f) →NDerivative(f) →NDerivative(f) →NDerivative(f) →NDerivative(f) →NDerivative(f) →NDerivative(f) →NDerivative(f) →NDerivative(f) →NDerivative(f) →NDerivative(f) →NDerivative(f) →NDerivative(f) →NDerivative(f) →NDerivative(f) →NDerivative(f) →NDerivative(f) →NDerivative(f) →