
3D Visualization of Volume of Revolution
Loading the math board and drawing, please wait…
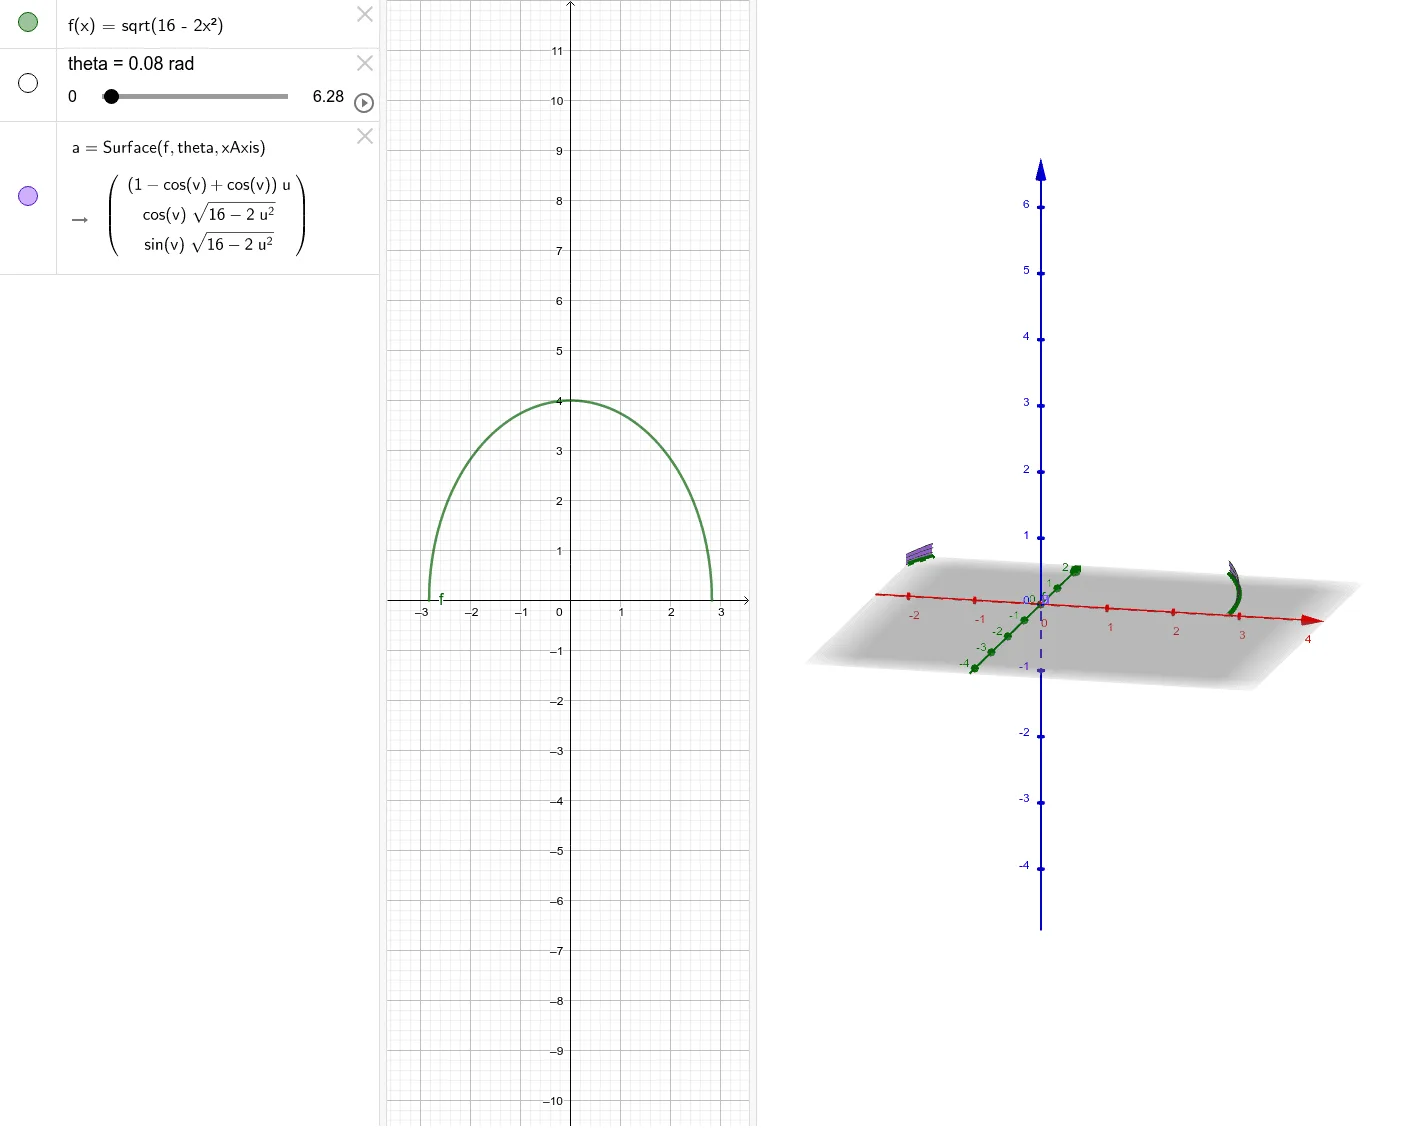
This example demonstrates how to visually represent the calculation process of the volume of a solid of revolution through 3D graphics. The core mathematical concepts involved include integration, the formula for the volume of solids of revolution in calculus, and the 3D function graph. Key construction points use GeoGebra's Surface command to plot 3D surfaces, with objects f (function), theta (angular parameter), and a (rotation radius parameter) to build the solid of revolution model. Suitable for high school and above students studying solid geometry and calculus, particularly understanding the formation and calculation of volumes of revolution.
GeoGebra Commands & Parameters
Surface(f, theta, xAxis) → a