
Dilation and Parabola Demonstration
Loading the math board and drawing, please wait…
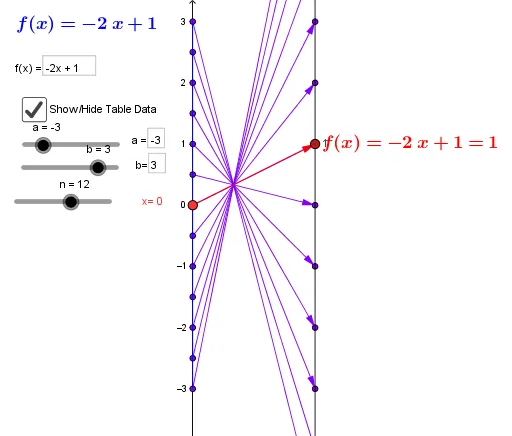
This example demonstrates the effect of dilation on a parabola and shows the formation process of a cone, involving concepts like dilation, parabola equation, cone cross-section distributions, and probability distributions. Key GeoGebra commands used include Point, Vector, Textfield, Sequence, and Segment for constructing the graphics. Suitable for high school and above mathematics learners to understand the application of transformation geometry and analytical geometry.
GeoGebra Commands & Parameters
Point(yAxis) → A_1Vector(A_1, B) → uTextfield(f) → inputBox1Textfield(f) → inputBox2Textfield(a) → inputBox3Textfield(b) → inputBox4Sequence((k, f(k)), k, a, b, Δx) → GraphptsSequence(Vector[(0, k), (2, (y_{zoom} * f(k)))], k, a, b, Δx) → MDSequence((0, k), k, a, b, Δx) → SourcePtsMDSequence((2, (y_{zoom} * f(k))), k, a, b, Δx) → TargPts_1Segment((0, a), (0, b)) → c
AI Drawing Prompt Reference
Draw a graph demonstrating the effect of dilation on a parabola, including a horizontal axis and two points connected by a vector. Input the parabola equation and a dilation factor, then generate a series of points based on the equation and connect them with line segments to form the parabola. Also, create two sets of points through dilation and connect the starting and target points with vectors. Finally, draw a vertical line segment connecting the two ends of the axis.
The prompt above was compiled from the original drawing commands and is for reference only.